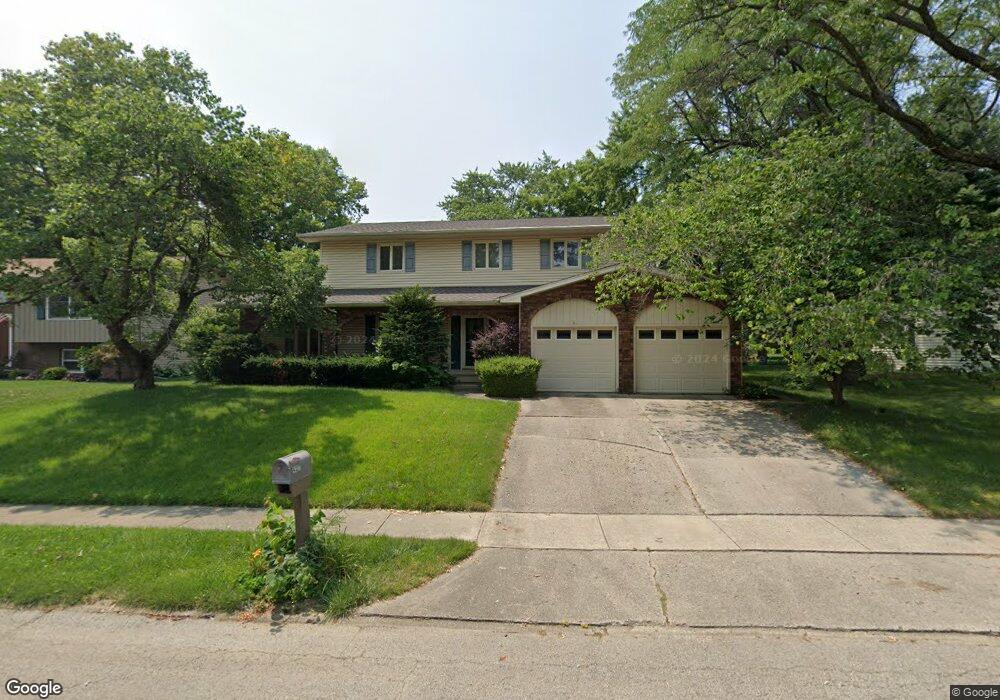
4327 N Leonore Dr Decatur, IL 62526
Cresthaven NeighborhoodEstimated Value: $201,000 - $249,000
4
Beds
3
Baths
3,508
Sq Ft
$63/Sq Ft
Est. Value
About This Home
This home is located at 4327 N Leonore Dr, Decatur, IL 62526 and is currently estimated at $220,176, approximately $62 per square foot. 4327 N Leonore Dr is a home located in Macon County with nearby schools including Parsons Elementary School, Stephen Decatur Middle School, and Our Lady of Lourdes School.
Ownership History
Date
Name
Owned For
Owner Type
Purchase Details
Closed on
Jul 15, 2019
Sold by
Taylor Nikkitha
Bought by
Taylor Adrian
Current Estimated Value
Home Financials for this Owner
Home Financials are based on the most recent Mortgage that was taken out on this home.
Original Mortgage
$132,682
Outstanding Balance
$117,812
Interest Rate
4.5%
Mortgage Type
FHA
Estimated Equity
$102,364
Purchase Details
Closed on
Jul 2, 2014
Sold by
Calendo Joseph and Calendo Tanya
Bought by
Taylor Adrian and Taylor Nikkitha
Home Financials for this Owner
Home Financials are based on the most recent Mortgage that was taken out on this home.
Original Mortgage
$137,464
Interest Rate
4%
Mortgage Type
FHA
Purchase Details
Closed on
Aug 23, 2006
Sold by
Dunscomb Justin A and Dunscomb Rebecca L
Bought by
Calendo Joseph and Calendo Tanya
Home Financials for this Owner
Home Financials are based on the most recent Mortgage that was taken out on this home.
Original Mortgage
$119,200
Interest Rate
6.78%
Mortgage Type
New Conventional
Purchase Details
Closed on
Jul 1, 2001
Create a Home Valuation Report for This Property
The Home Valuation Report is an in-depth analysis detailing your home's value as well as a comparison with similar homes in the area
Home Values in the Area
Average Home Value in this Area
Purchase History
| Date | Buyer | Sale Price | Title Company |
|---|---|---|---|
| Taylor Adrian | -- | None Available | |
| Taylor Adrian | $140,000 | None Available | |
| Calendo Joseph | $149,000 | None Available | |
| -- | $135,000 | -- |
Source: Public Records
Mortgage History
| Date | Status | Borrower | Loan Amount |
|---|---|---|---|
| Open | Taylor Adrian | $132,682 | |
| Closed | Taylor Adrian | $137,464 | |
| Previous Owner | Calendo Joseph | $119,200 |
Source: Public Records
Tax History Compared to Growth
Tax History
| Year | Tax Paid | Tax Assessment Tax Assessment Total Assessment is a certain percentage of the fair market value that is determined by local assessors to be the total taxable value of land and additions on the property. | Land | Improvement |
|---|---|---|---|---|
| 2024 | $5,683 | $63,563 | $6,747 | $56,816 |
| 2023 | $5,281 | $58,432 | $6,202 | $52,230 |
| 2022 | $4,979 | $54,193 | $5,752 | $48,441 |
| 2021 | $4,682 | $51,132 | $5,379 | $45,753 |
| 2020 | $4,701 | $50,075 | $5,268 | $44,807 |
| 2019 | $4,701 | $50,075 | $5,268 | $44,807 |
| 2018 | $4,680 | $50,433 | $5,306 | $45,127 |
| 2017 | $5,330 | $50,714 | $5,335 | $45,379 |
| 2016 | $5,382 | $50,836 | $5,348 | $45,488 |
| 2015 | $5,138 | $50,234 | $5,285 | $44,949 |
| 2014 | $4,240 | $50,234 | $5,285 | $44,949 |
| 2013 | $4,224 | $50,234 | $5,285 | $44,949 |
Source: Public Records
Map
Nearby Homes
- 619 Arthur Ct
- 4444 N Adams Dr
- 4074 Sheffield Ct
- 810 Sarah Dr
- 4499 Lawson Dr
- 365 W Ash Ave
- 4616 Lawson Dr
- 880 W Frank Dr
- 4636 Lawson Dr
- 416 Southampton Dr
- 278 W Brown Ave
- 4643 Nicklaus Ct
- 933 W Frank Dr
- 235 W Ash Ave
- 3981 N Northbrook Dr
- 204 Newcastle Dr
- 0 Route 51 Unit 6241333
- 3959 N Cambridge Dr
- 16 Surrey Ln
- 3707 N Woodridge Dr
- 4317 N Leonore Dr
- 4337 N Leonore Dr
- 724 W Harold Cir
- 4357 N Leonore Dr
- 4326 N Leonore Dr
- 744 W Harold Cir
- 4322 Leslie Ln
- 4336 N Leonore Dr
- 4332 Leslie Ln
- 4346 N Leonore Dr
- 717 W Harold Cir
- 4316 N Leonore Dr
- 737 W Harold Cir
- 4356 N Leonore Dr
- 727 W Harold Cir
- 4306 N Leonore Dr
- 4312 Leslie Ln
- 4367 N Leonore Dr
- 4343 Sheila Ct
- 757 W Harold Cir