Estimated Value: $413,000 - $466,000
3
Beds
3
Baths
1,720
Sq Ft
$251/Sq Ft
Est. Value
About This Home
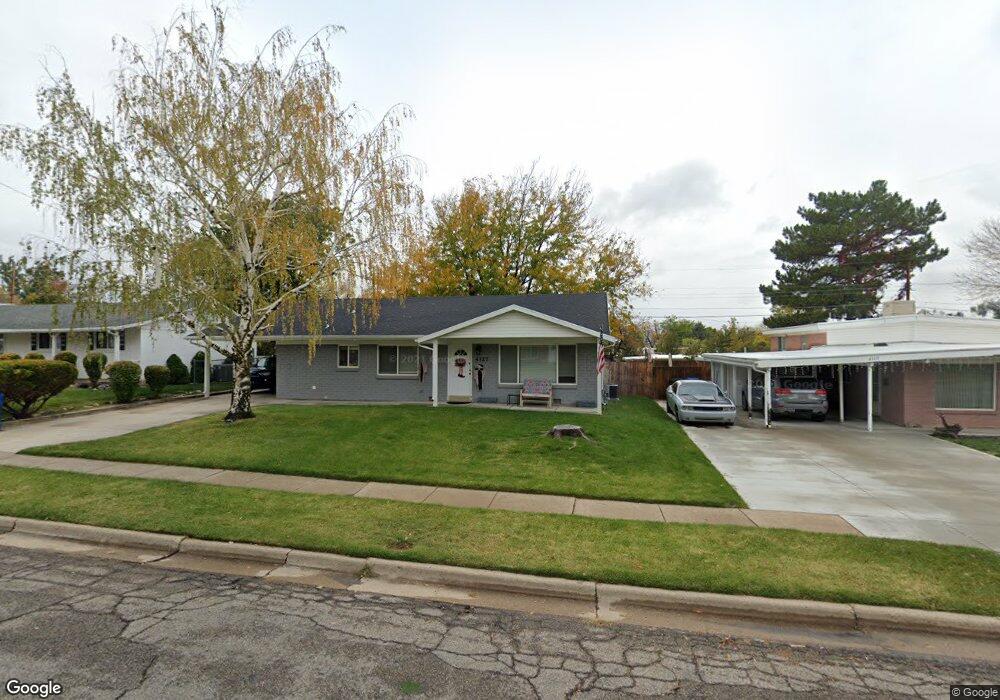
This home is located at 4327 S 900 E, Ogden, UT 84403 and is currently estimated at $430,914, approximately $250 per square foot. 4327 S 900 E is a home located in Weber County with nearby schools including Burch Creek School, South Ogden Junior High School, and Bonneville High School.
Ownership History
Date
Name
Owned For
Owner Type
Purchase Details
Closed on
Oct 22, 2018
Sold by
Gallegos Tanya Hayman and Hayman Tanya
Bought by
Hayman Tanya
Current Estimated Value
Home Financials for this Owner
Home Financials are based on the most recent Mortgage that was taken out on this home.
Original Mortgage
$204,000
Outstanding Balance
$177,534
Interest Rate
4.5%
Mortgage Type
New Conventional
Estimated Equity
$253,380
Purchase Details
Closed on
Aug 31, 2018
Sold by
Bassett Douglas J and Mccall John L
Bought by
Gallegos Tanya Hayman
Home Financials for this Owner
Home Financials are based on the most recent Mortgage that was taken out on this home.
Original Mortgage
$204,000
Outstanding Balance
$177,534
Interest Rate
4.5%
Mortgage Type
New Conventional
Estimated Equity
$253,380
Purchase Details
Closed on
Jan 22, 2016
Sold by
Croft Robin Anne and Dunifer Lou Ann M
Bought by
Ambience Construction & Development Inc
Create a Home Valuation Report for This Property
The Home Valuation Report is an in-depth analysis detailing your home's value as well as a comparison with similar homes in the area
Home Values in the Area
Average Home Value in this Area
Purchase History
| Date | Buyer | Sale Price | Title Company |
|---|---|---|---|
| Hayman Tanya | -- | None Available | |
| Gallegos Tanya Hayman | -- | Mountain View Title | |
| Ambience Construction & Development Inc | -- | Mountain View Title |
Source: Public Records
Mortgage History
| Date | Status | Borrower | Loan Amount |
|---|---|---|---|
| Open | Gallegos Tanya Hayman | $204,000 |
Source: Public Records
Tax History
| Year | Tax Paid | Tax Assessment Tax Assessment Total Assessment is a certain percentage of the fair market value that is determined by local assessors to be the total taxable value of land and additions on the property. | Land | Improvement |
|---|---|---|---|---|
| 2025 | $2,922 | $410,201 | $108,544 | $301,657 |
| 2024 | $2,789 | $219,999 | $59,699 | $160,300 |
| 2023 | $2,596 | $204,600 | $59,712 | $144,888 |
| 2022 | $2,458 | $199,100 | $54,383 | $144,717 |
| 2021 | $2,096 | $283,000 | $59,193 | $223,807 |
| 2020 | $1,967 | $247,000 | $44,348 | $202,652 |
| 2019 | $1,834 | $218,000 | $33,862 | $184,138 |
| 2018 | $1,290 | $136,054 | $33,862 | $102,192 |
| 2017 | $1,435 | $150,000 | $33,862 | $116,138 |
| 2016 | $1,285 | $73,677 | $19,056 | $54,621 |
| 2015 | $1,298 | $73,223 | $19,056 | $54,167 |
| 2014 | $1,240 | $68,897 | $19,056 | $49,841 |
Source: Public Records
Map
Nearby Homes
- 1113 Country Hills Dr Unit B2
- 1113 Country Hills Dr Unit E1
- 796 Nancy Dr
- 4079 S 895 E Unit 67
- 685 Lavina Dr
- 4785 Panorama Dr
- 3925 S Evelyn Rd
- 4723 Madison Ave
- 4586 Porter Ave
- 3878 Grandview Dr
- 1070 40th St
- 4840 S 1000 E
- 4685 Porter Ave
- 904 39th St
- 3935 Nordin Ave
- 3856 Grandview Dr
- 1165 Edgewood Dr
- 4014 Porter Ave
- 3828 Quincy Ave
- 3845 Nordin Ave
Your Personal Tour Guide
Ask me questions while you tour the home.