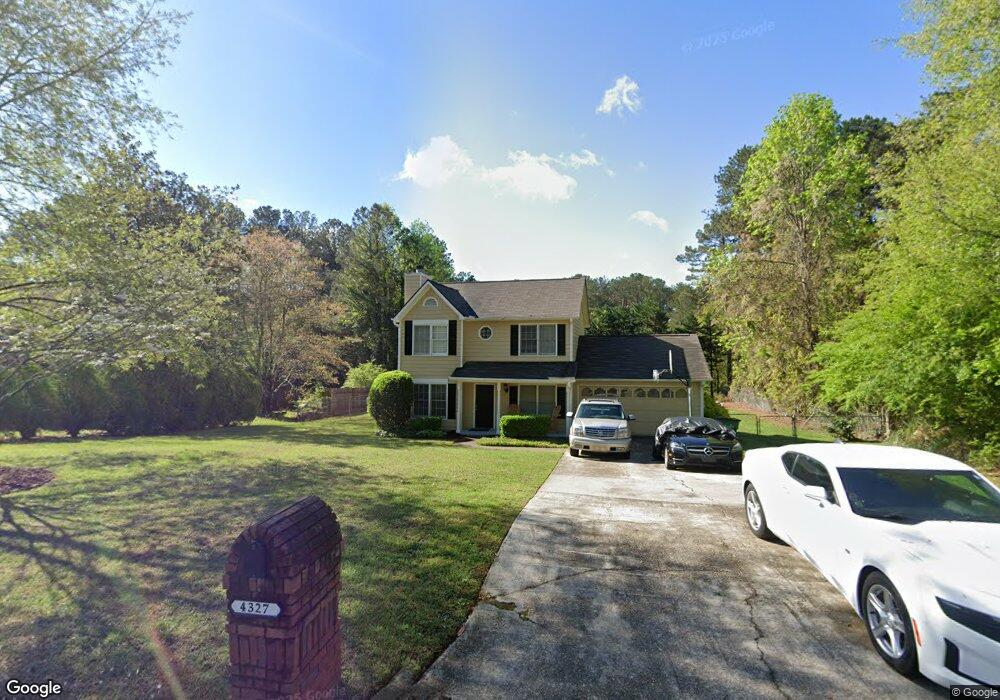
4327 Shiloh Trail Powder Springs, GA 30127
West Cobb NeighborhoodEstimated Value: $278,000 - $353,946
3
Beds
3
Baths
1,444
Sq Ft
$226/Sq Ft
Est. Value
About This Home
This home is located at 4327 Shiloh Trail, Powder Springs, GA 30127 and is currently estimated at $326,237, approximately $225 per square foot. 4327 Shiloh Trail is a home located in Cobb County with nearby schools including Kemp Elementary School, Lovinggood Middle School, and Hillgrove High School.
Ownership History
Date
Name
Owned For
Owner Type
Purchase Details
Closed on
Apr 19, 2019
Sold by
Hopper Michael E
Bought by
Richardson Wade T and Fox Terrie G
Current Estimated Value
Purchase Details
Closed on
Sep 29, 2004
Sold by
Ellis Ronnie H and Ellis Kelly
Bought by
Fox Terrie G
Home Financials for this Owner
Home Financials are based on the most recent Mortgage that was taken out on this home.
Original Mortgage
$110,400
Interest Rate
5.73%
Mortgage Type
New Conventional
Purchase Details
Closed on
Nov 30, 2000
Sold by
Stephens Jeff
Bought by
Deno Kelly M
Home Financials for this Owner
Home Financials are based on the most recent Mortgage that was taken out on this home.
Original Mortgage
$119,000
Interest Rate
7.71%
Mortgage Type
FHA
Purchase Details
Closed on
Aug 24, 2000
Sold by
Esparza Jose M and Esparza Lucila
Bought by
Stephens Jeff
Home Financials for this Owner
Home Financials are based on the most recent Mortgage that was taken out on this home.
Original Mortgage
$76,500
Interest Rate
8.24%
Mortgage Type
New Conventional
Create a Home Valuation Report for This Property
The Home Valuation Report is an in-depth analysis detailing your home's value as well as a comparison with similar homes in the area
Home Values in the Area
Average Home Value in this Area
Purchase History
| Date | Buyer | Sale Price | Title Company |
|---|---|---|---|
| Richardson Wade T | $142,000 | -- | |
| Fox Terrie G | $122,000 | -- | |
| Deno Kelly M | $120,000 | -- | |
| Stephens Jeff | $94,900 | -- |
Source: Public Records
Mortgage History
| Date | Status | Borrower | Loan Amount |
|---|---|---|---|
| Previous Owner | Fox Terrie G | $110,400 | |
| Previous Owner | Deno Kelly M | $119,000 | |
| Previous Owner | Stephens Jeff | $76,500 |
Source: Public Records
Tax History Compared to Growth
Tax History
| Year | Tax Paid | Tax Assessment Tax Assessment Total Assessment is a certain percentage of the fair market value that is determined by local assessors to be the total taxable value of land and additions on the property. | Land | Improvement |
|---|---|---|---|---|
| 2025 | $794 | $134,040 | $36,000 | $98,040 |
| 2024 | $778 | $127,696 | $16,000 | $111,696 |
| 2023 | $572 | $127,696 | $16,000 | $111,696 |
| 2022 | $621 | $75,380 | $9,040 | $66,340 |
| 2021 | $1,724 | $56,800 | $9,040 | $47,760 |
| 2020 | $1,724 | $56,800 | $9,040 | $47,760 |
| 2019 | $1,961 | $64,612 | $7,200 | $57,412 |
| 2018 | $1,961 | $64,612 | $7,200 | $57,412 |
| 2017 | $1,210 | $42,092 | $7,200 | $34,892 |
| 2016 | $1,210 | $42,092 | $7,200 | $34,892 |
| 2015 | $1,240 | $42,092 | $7,200 | $34,892 |
| 2014 | $1,251 | $42,092 | $0 | $0 |
Source: Public Records
Map
Nearby Homes
- 4408 Shiloh Trail
- 1073 Sweet Mia Ln
- 1072 Sweet Mia Ln
- 1077 Sweet Mia Ln
- 1150 Sweet Mia Ln
- 1079 Angel Ln
- 3840 McEachern Farm Dr
- 1175 Bowerie Chase
- 4927 Red Cliff Ct
- 1827 Lost Mountain Rd
- 4562 Willow Oak Trail Unit 3
- 990 Casteel Rd
- 0 Lost Mountain Rd Unit 7653787
- 0 Lost Mountain Rd Unit 10610707
- 777 Chanson Dr SW
- 700 Broadlands Ln Unit 1
- 1830 Lost Mountain Rd
- 4325 Shiloh Trail
- 4337 Shiloh Trail Unit 1
- 4315 Shiloh Trail Unit 2
- 4338 Shiloh Trail Unit I/5
- 4338 Shiloh Trail
- 4347 Shiloh Trail
- 4328 Shiloh Trail
- 4318 Shiloh Trail Unit 2
- 1251 Jordan Rd
- 4348 Shiloh Trail
- 4305 Shiloh Trail
- 4357 Shiloh Trail
- 1255 Jordan Rd
- 4295 Shiloh Trail Unit 2
- 4314 Shiloh Trail
- 4358 Shiloh Trail
- 4367 Shiloh Trail
- 4310 Shiloh Trail
- 4368 Shiloh Trail
- 4294 Shiloh Trail