Estimated Value: $595,000 - $681,000
3
Beds
3
Baths
2,375
Sq Ft
$265/Sq Ft
Est. Value
About This Home
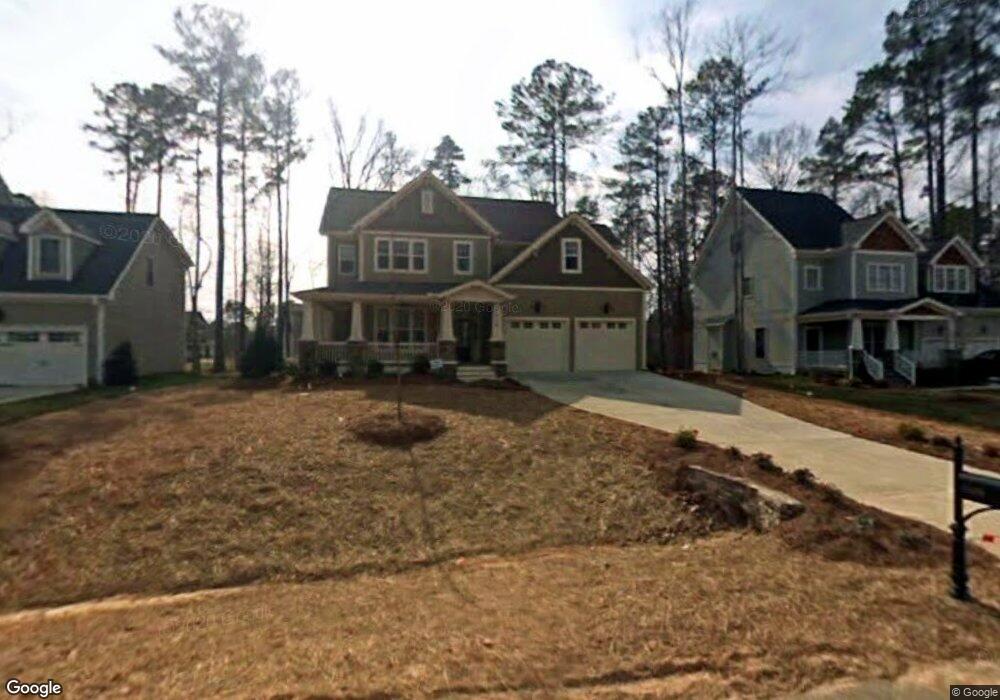
This home is located at 4328 Brighton Ridge Dr, Apex, NC 27539 and is currently estimated at $628,458, approximately $264 per square foot. 4328 Brighton Ridge Dr is a home located in Wake County with nearby schools including West Lake Elementary School, West Lake Middle, and Middle Creek High.
Ownership History
Date
Name
Owned For
Owner Type
Purchase Details
Closed on
Dec 11, 2015
Sold by
Tucci Mark S and Tucci Dana
Bought by
Richer Gregory S
Current Estimated Value
Home Financials for this Owner
Home Financials are based on the most recent Mortgage that was taken out on this home.
Original Mortgage
$150,000
Outstanding Balance
$118,466
Interest Rate
3.83%
Mortgage Type
New Conventional
Estimated Equity
$509,992
Purchase Details
Closed on
Jan 18, 2008
Sold by
Robuck Homes Triangle Llc
Bought by
Tucci Mark and Tucci Dana
Home Financials for this Owner
Home Financials are based on the most recent Mortgage that was taken out on this home.
Original Mortgage
$170,387
Interest Rate
6.12%
Mortgage Type
Purchase Money Mortgage
Create a Home Valuation Report for This Property
The Home Valuation Report is an in-depth analysis detailing your home's value as well as a comparison with similar homes in the area
Home Values in the Area
Average Home Value in this Area
Purchase History
| Date | Buyer | Sale Price | Title Company |
|---|---|---|---|
| Richer Gregory S | $338,500 | None Available | |
| Tucci Mark | $295,500 | None Available |
Source: Public Records
Mortgage History
| Date | Status | Borrower | Loan Amount |
|---|---|---|---|
| Open | Richer Gregory S | $150,000 | |
| Previous Owner | Tucci Mark | $170,387 |
Source: Public Records
Tax History Compared to Growth
Tax History
| Year | Tax Paid | Tax Assessment Tax Assessment Total Assessment is a certain percentage of the fair market value that is determined by local assessors to be the total taxable value of land and additions on the property. | Land | Improvement |
|---|---|---|---|---|
| 2025 | $4,859 | $552,995 | $140,000 | $412,995 |
| 2024 | $4,839 | $552,995 | $140,000 | $412,995 |
| 2023 | $4,006 | $358,432 | $90,000 | $268,432 |
| 2022 | $3,764 | $358,432 | $90,000 | $268,432 |
| 2021 | $3,586 | $358,432 | $90,000 | $268,432 |
| 2020 | $3,586 | $358,432 | $90,000 | $268,432 |
| 2019 | $3,565 | $307,376 | $85,000 | $222,376 |
| 2018 | $3,361 | $307,376 | $85,000 | $222,376 |
| 2017 | $3,240 | $307,376 | $85,000 | $222,376 |
| 2016 | $3,195 | $307,376 | $85,000 | $222,376 |
| 2015 | $2,909 | $289,056 | $54,000 | $235,056 |
| 2014 | -- | $289,056 | $54,000 | $235,056 |
Source: Public Records
Map
Nearby Homes
- 4324 Brighton Ridge Dr
- 2699 Needle Pine Dr
- 2512 Thurrock Dr
- 2724 Glastonbury Rd
- 2813 Glastonbury Rd
- 3101 Canopy Woods Dr
- 9645 Eden Trail
- 9705/9713 Lake Wheeler Rd
- 9704 Eden Trail
- 4601 Okeechobee Ct
- 2629 Brad Ct
- 4805 Ozark St
- 4317 Glen Arbor Dr
- 4301 New Brighton Dr
- 3712 Sawyers Mill Dr
- 3408 Sawyers Mill Dr
- 3101 Sawyers Mill Dr
- 5417 Willow Bridge Ln
- 5217 W Oaks Dr
- 4716 Shady Greens Dr
- 4332 Brighton Ridge Dr
- 4321 White Trillium Ln
- 4336 Brighton Ridge Dr
- 4317 White Trillium Ln
- 4325 Brighton Ridge Dr
- 4329 Brighton Ridge Dr
- 4316 Brighton Ridge Dr
- 4325 White Trillium Ln
- 4340 Brighton Ridge Dr
- 4333 Brighton Ridge Dr
- 4313 White Trillium Ln
- 4313 Brighton Ridge Dr
- 4312 Brighton Ridge Dr
- 4309 White Trillium Ln
- 4324 White Trillium Ln
- 2401 Thurrock Dr
- 4309 Brighton Ridge Dr
- 4308 Brighton Ridge Dr
- 2400 Thurrock Dr
- 4305 White Trillium Ln