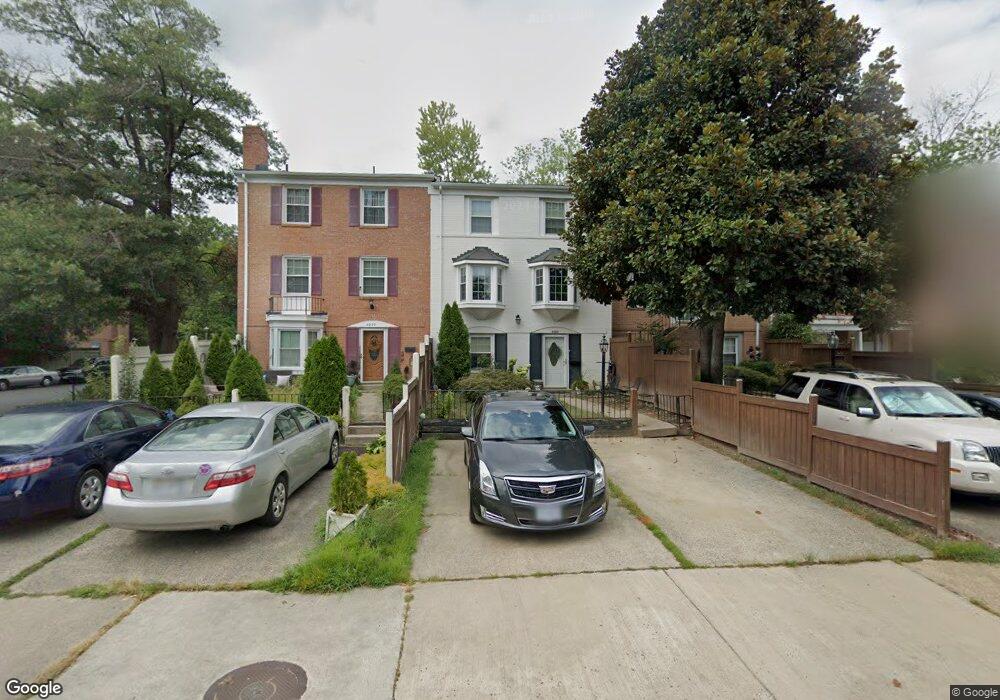
4328 Gramercy Cir Alexandria, VA 22309
Woodlawn NeighborhoodEstimated Value: $479,000 - $525,000
4
Beds
3
Baths
1,408
Sq Ft
$358/Sq Ft
Est. Value
About This Home
This home is located at 4328 Gramercy Cir, Alexandria, VA 22309 and is currently estimated at $504,276, approximately $358 per square foot. 4328 Gramercy Cir is a home located in Fairfax County with nearby schools including Woodlawn Elementary School, Whitman Middle School, and Mount Vernon High.
Ownership History
Date
Name
Owned For
Owner Type
Purchase Details
Closed on
Jan 2, 1998
Sold by
Ramkrish Properties Inc
Bought by
Seay Charles Lloyd
Current Estimated Value
Home Financials for this Owner
Home Financials are based on the most recent Mortgage that was taken out on this home.
Original Mortgage
$119,990
Outstanding Balance
$20,769
Interest Rate
7.11%
Mortgage Type
FHA
Estimated Equity
$483,507
Purchase Details
Closed on
Feb 28, 1997
Sold by
Patel Ramesh I and Patel Jaya R
Bought by
Ramkrish Properties Inc
Purchase Details
Closed on
Mar 15, 1994
Sold by
Sec Vet Affr
Bought by
Patel Ramesh I
Home Financials for this Owner
Home Financials are based on the most recent Mortgage that was taken out on this home.
Original Mortgage
$132,000
Interest Rate
6.93%
Purchase Details
Closed on
Oct 20, 1993
Sold by
Cornish
Bought by
Sec Vet Affr
Create a Home Valuation Report for This Property
The Home Valuation Report is an in-depth analysis detailing your home's value as well as a comparison with similar homes in the area
Home Values in the Area
Average Home Value in this Area
Purchase History
| Date | Buyer | Sale Price | Title Company |
|---|---|---|---|
| Seay Charles Lloyd | $120,000 | -- | |
| Ramkrish Properties Inc | -- | -- | |
| Patel Ramesh I | $133,500 | -- | |
| Sec Vet Affr | $118,459 | -- |
Source: Public Records
Mortgage History
| Date | Status | Borrower | Loan Amount |
|---|---|---|---|
| Open | Sec Vet Affr | $119,990 | |
| Previous Owner | Sec Vet Affr | $132,000 |
Source: Public Records
Tax History Compared to Growth
Tax History
| Year | Tax Paid | Tax Assessment Tax Assessment Total Assessment is a certain percentage of the fair market value that is determined by local assessors to be the total taxable value of land and additions on the property. | Land | Improvement |
|---|---|---|---|---|
| 2025 | $5,191 | $471,490 | $127,000 | $344,490 |
| 2024 | $5,191 | $448,090 | $120,000 | $328,090 |
| 2023 | $4,950 | $438,620 | $120,000 | $318,620 |
| 2022 | $4,629 | $404,790 | $110,000 | $294,790 |
| 2021 | $4,369 | $372,290 | $85,000 | $287,290 |
| 2020 | $4,106 | $346,920 | $80,000 | $266,920 |
| 2019 | $3,905 | $329,980 | $80,000 | $249,980 |
| 2018 | $3,795 | $329,980 | $80,000 | $249,980 |
| 2017 | $3,613 | $311,220 | $80,000 | $231,220 |
| 2016 | $3,468 | $299,330 | $80,000 | $219,330 |
| 2015 | $3,341 | $299,330 | $80,000 | $219,330 |
| 2014 | $3,138 | $281,830 | $80,000 | $201,830 |
Source: Public Records
Map
Nearby Homes
- 8042 Saint Annes Ct
- 7927 Ashboro Dr
- 8113 Pinelake Ct
- 7926 Russell Rd
- 7952 Hammond St
- 8018 Imperial St
- 7912 Central Park Cir
- 7916 Central Park Cir
- 8141 Lakepark Dr
- 4111 Lawrence St
- 4403 Aspen Dr
- 7911 Martha Washington St
- 7908 Steadman St
- 8019 Beckner Ct
- 8213 Hocking Place
- 7913 Fitzroy St
- 4811 Welford St
- 4403 Wyres St
- 8336 Claremont Woods Dr
- 4821 Lawrence St
- 4326 Gramercy Cir
- 4330 Gramercy Cir
- 4324 Gramercy Cir
- 4322 Gramercy Cir
- 4320 Gramercy Cir
- 4439 Longworthe Square
- 4437 Longworthe Square
- 4435 Longworthe Square
- 4433 Longworthe Square
- 4431 Longworthe Square
- 4316 Gramercy Cir
- 4429 Longworthe Square
- 4427 Longworthe Square
- 4501 Squiredale Square
- 8030 Central Park Dr
- 8032 Central Park Dr
- 4314 Gramercy Cir
- 8034 Central Park Dr
- 8036 Central Park Dr
- 4425 Longworthe Square