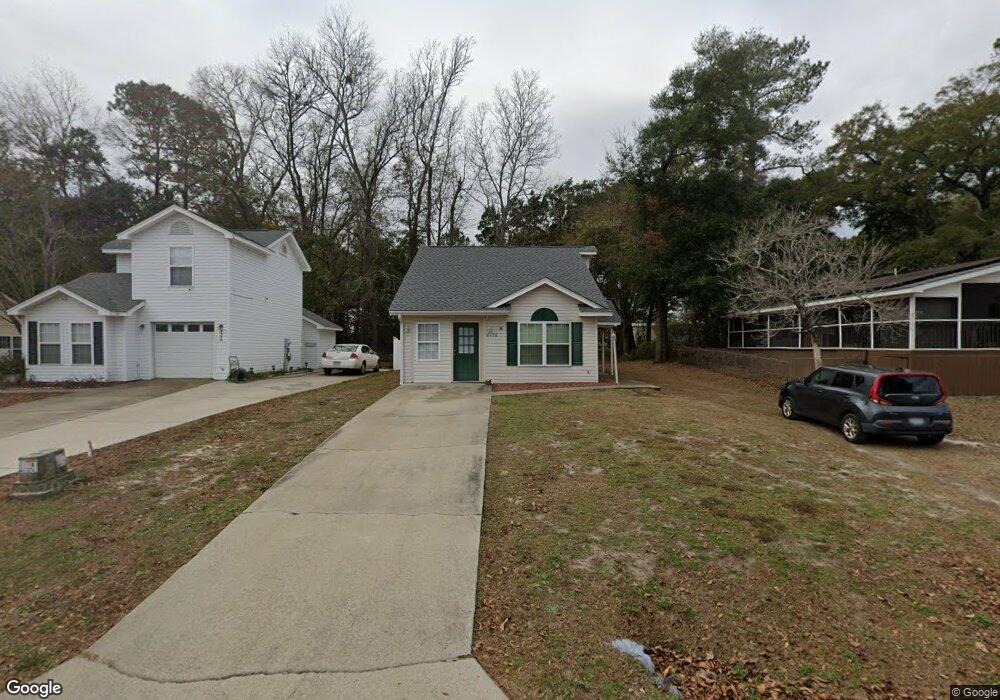
4328 Landing Rd Little River, SC 29566
Estimated Value: $197,000 - $355,000
3
Beds
2
Baths
1,052
Sq Ft
$237/Sq Ft
Est. Value
About This Home
This home is located at 4328 Landing Rd, Little River, SC 29566 and is currently estimated at $249,731, approximately $237 per square foot. 4328 Landing Rd is a home located in Horry County with nearby schools including Ocean Drive Elementary School, North Myrtle Beach Middle School, and North Myrtle Beach High School.
Ownership History
Date
Name
Owned For
Owner Type
Purchase Details
Closed on
Feb 22, 2006
Sold by
Federal Home Loan Mortgage Corporation
Bought by
Kovac Anna L and Kovac Michael R
Current Estimated Value
Home Financials for this Owner
Home Financials are based on the most recent Mortgage that was taken out on this home.
Original Mortgage
$100,000
Outstanding Balance
$56,263
Interest Rate
6.19%
Mortgage Type
Fannie Mae Freddie Mac
Estimated Equity
$193,468
Purchase Details
Closed on
Mar 15, 2005
Sold by
Dwiggins Judy E
Bought by
Federal Home Loan Mortgage Corporation
Purchase Details
Closed on
Nov 27, 2001
Sold by
James Dwiggins
Bought by
Dwiggins James and Dwiggins Judy E
Create a Home Valuation Report for This Property
The Home Valuation Report is an in-depth analysis detailing your home's value as well as a comparison with similar homes in the area
Home Values in the Area
Average Home Value in this Area
Purchase History
| Date | Buyer | Sale Price | Title Company |
|---|---|---|---|
| Kovac Anna L | $140,000 | None Available | |
| Federal Home Loan Mortgage Corporation | $100,000 | -- | |
| Dwiggins James | -- | -- |
Source: Public Records
Mortgage History
| Date | Status | Borrower | Loan Amount |
|---|---|---|---|
| Open | Kovac Anna L | $100,000 |
Source: Public Records
Tax History Compared to Growth
Tax History
| Year | Tax Paid | Tax Assessment Tax Assessment Total Assessment is a certain percentage of the fair market value that is determined by local assessors to be the total taxable value of land and additions on the property. | Land | Improvement |
|---|---|---|---|---|
| 2024 | $1,838 | $12,707 | $5,117 | $7,590 |
| 2023 | $1,838 | $7,567 | $1,945 | $5,622 |
| 2021 | $1,700 | $7,567 | $1,945 | $5,622 |
| 2020 | $1,597 | $7,567 | $1,945 | $5,622 |
| 2019 | $1,597 | $7,567 | $1,945 | $5,622 |
| 2018 | $0 | $6,683 | $1,343 | $5,340 |
| 2017 | $1,450 | $6,683 | $1,343 | $5,340 |
| 2016 | -- | $6,683 | $1,343 | $5,340 |
| 2015 | $1,450 | $6,684 | $1,344 | $5,340 |
| 2014 | $1,402 | $6,684 | $1,344 | $5,340 |
Source: Public Records
Map
Nearby Homes
- 4338 Landing Rd
- 4341 Landing Rd
- 4417 Barcelona Ln
- 4359 Landing Rd
- 4363 Bayshore Dr
- 4233 River Gate Ln Unit B
- 4243 River Gate Ln
- 4269 River Gate Ln Unit 21B
- 4271 Hibiscus Dr Unit 3- 101 Gardens
- 4271 Hibiscus Dr Unit 3-302
- 4271 McLamb Ave
- 4350 Intercoastal Dr Unit 1403
- 4350 Intercoastal Dr Unit 2402
- 4350 Intercoastal Dr Unit 1404
- 4225 River Gate Ln Unit 28B
- 448 Papyrus Cir Unit 448
- 4261 Hibiscus Dr Unit 103 GARDENS @ CYPRE
- 4261 Hibiscus Dr Unit 4-104
- 4290 Pinehurst Cir Unit B6
- 4207 Pinehurst Cir Unit I6
- 4330 Landing Rd
- 4330 Landing Rd
- 4326 Landing Rd
- 4332 Landing Rd
- 4324 Landing Rd
- 4329 Landing Rd Unit Little River Heights
- 4329 Landing Rd Unit Lot 53
- 4325 Landing Rd Unit Little River Heights
- 4325 Landing Rd
- 4331 Landing Rd
- 4331 Landing Rd Unit Little River Heights
- 4320 Landing Rd Unit Little River Heights
- 4320 Landing Rd
- 4336 Landing Rd
- 4323 Landing Rd
- 4333 Landing Rd
- TBD Landing Rd Unit Little River Heights
- TBD Landing Rd
- 4321 Landing Rd
- 4337 Landing Rd