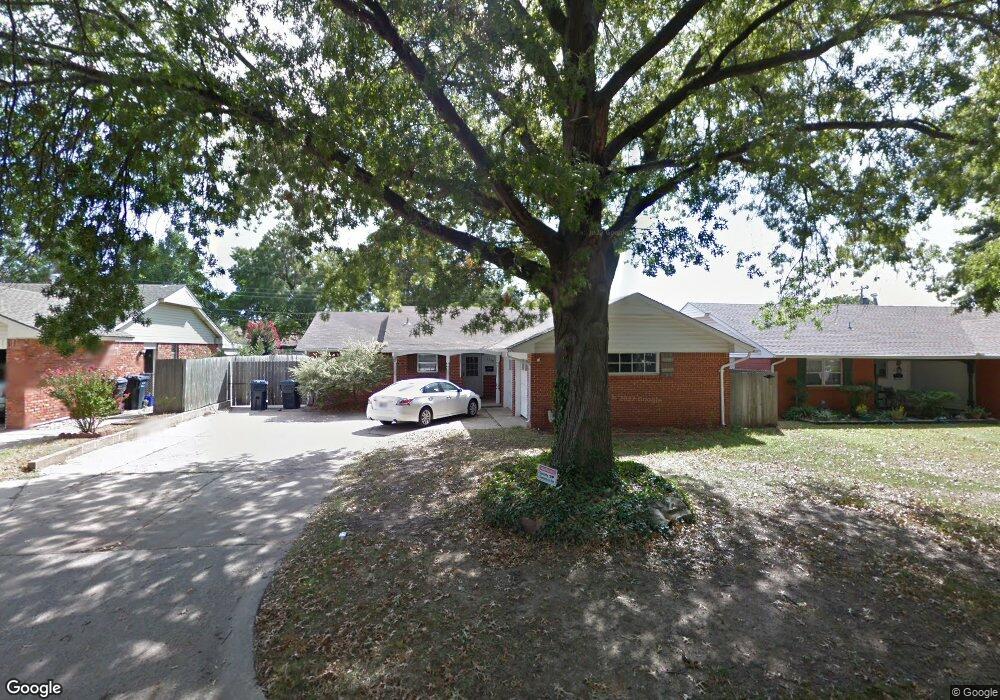
4328 NW 54th St Oklahoma City, OK 73112
Springdale NeighborhoodEstimated Value: $169,000 - $183,000
3
Beds
2
Baths
1,136
Sq Ft
$155/Sq Ft
Est. Value
About This Home
This home is located at 4328 NW 54th St, Oklahoma City, OK 73112 and is currently estimated at $176,088, approximately $155 per square foot. 4328 NW 54th St is a home located in Oklahoma County with nearby schools including Coronado Heights Elementary School, James L. Capps Middle School, and Putnam City High School.
Ownership History
Date
Name
Owned For
Owner Type
Purchase Details
Closed on
Mar 31, 2011
Sold by
Howeth Richard Kyle and Howeth Stacy
Bought by
Stephen A Bruno 1995 Revocable Trust
Current Estimated Value
Purchase Details
Closed on
Aug 27, 2009
Sold by
Franklin Blake and Franklin Jada Lynn
Bought by
Howeth Richard Kyle
Home Financials for this Owner
Home Financials are based on the most recent Mortgage that was taken out on this home.
Original Mortgage
$10,950
Interest Rate
5.26%
Mortgage Type
Stand Alone Second
Purchase Details
Closed on
Jan 7, 2009
Sold by
Franklin Blake and Franklin Jada Lynn
Bought by
Franklin Blake and Franklin Jada Lynn
Purchase Details
Closed on
Jun 23, 2000
Sold by
Barlow Stacey Renee
Bought by
Franklin Blake
Purchase Details
Closed on
May 26, 1999
Sold by
Hambright Patricia A
Bought by
Barlow Stacey Renee
Create a Home Valuation Report for This Property
The Home Valuation Report is an in-depth analysis detailing your home's value as well as a comparison with similar homes in the area
Home Values in the Area
Average Home Value in this Area
Purchase History
| Date | Buyer | Sale Price | Title Company |
|---|---|---|---|
| Stephen A Bruno 1995 Revocable Trust | $106,000 | The Oklahoma City Abstract & | |
| Howeth Richard Kyle | $109,500 | Capitol Abstract & Title Co | |
| Franklin Blake | -- | American Guaranty Title Co | |
| Franklin Blake | $67,500 | American Guaranty Title Co | |
| Barlow Stacey Renee | $59,000 | -- |
Source: Public Records
Mortgage History
| Date | Status | Borrower | Loan Amount |
|---|---|---|---|
| Previous Owner | Howeth Richard Kyle | $10,950 | |
| Previous Owner | Howeth Richard Kyle | $87,600 |
Source: Public Records
Tax History Compared to Growth
Tax History
| Year | Tax Paid | Tax Assessment Tax Assessment Total Assessment is a certain percentage of the fair market value that is determined by local assessors to be the total taxable value of land and additions on the property. | Land | Improvement |
|---|---|---|---|---|
| 2024 | $1,770 | $15,241 | $2,862 | $12,379 |
| 2023 | $1,770 | $14,516 | $2,338 | $12,178 |
| 2022 | $1,706 | $13,825 | $2,507 | $11,318 |
| 2021 | $1,609 | $13,167 | $2,799 | $10,368 |
| 2020 | $1,526 | $12,540 | $2,852 | $9,688 |
| 2019 | $1,444 | $12,045 | $2,492 | $9,553 |
| 2018 | $1,380 | $11,495 | $0 | $0 |
| 2017 | $1,340 | $11,145 | $2,488 | $8,657 |
| 2016 | $1,274 | $10,614 | $2,492 | $8,122 |
| 2015 | $1,250 | $10,291 | $2,376 | $7,915 |
| 2014 | $1,312 | $11,229 | $2,376 | $8,853 |
Source: Public Records
Map
Nearby Homes
- 4406 NW 54th St
- 4333 NW 55th St
- 4312 NW 56th Terrace
- 4124 NW 56th St
- 4129 NW 51st St
- 5714 N Meridian Ave
- 4117 NW 56th Place
- 4129 NW 57th St
- 4405 NW 59th St
- 4105 NW 50th St
- 4219 NW 58th St
- 5800 N Meridian Place
- 4221 NW 60th Place
- 4324 NW 47th St
- 4401 NW 60th St
- 5906 N Shawnee Ave
- 4009 NW 59th St
- 4400 NW 46th St
- 4212 NW 45th St
- 4317 NW 45th St
- 4336 NW 54th St
- 4324 NW 54th St
- 4340 NW 54th St
- 4320 NW 54th St
- 4329 NW 53rd St
- 4333 NW 53rd St
- 4325 NW 53rd St
- 4400 NW 54th St
- 4331 NW 54th St
- 4337 NW 53rd St
- 4335 NW 54th St
- 4325 NW 54th St
- 4321 NW 53rd St
- 4339 NW 54th St
- 4321 NW 54th St
- 4341 NW 53rd St
- 4317 NW 53rd St
- 4401 NW 54th St
- 4312 NW 54th St
- 4317 NW 54th St