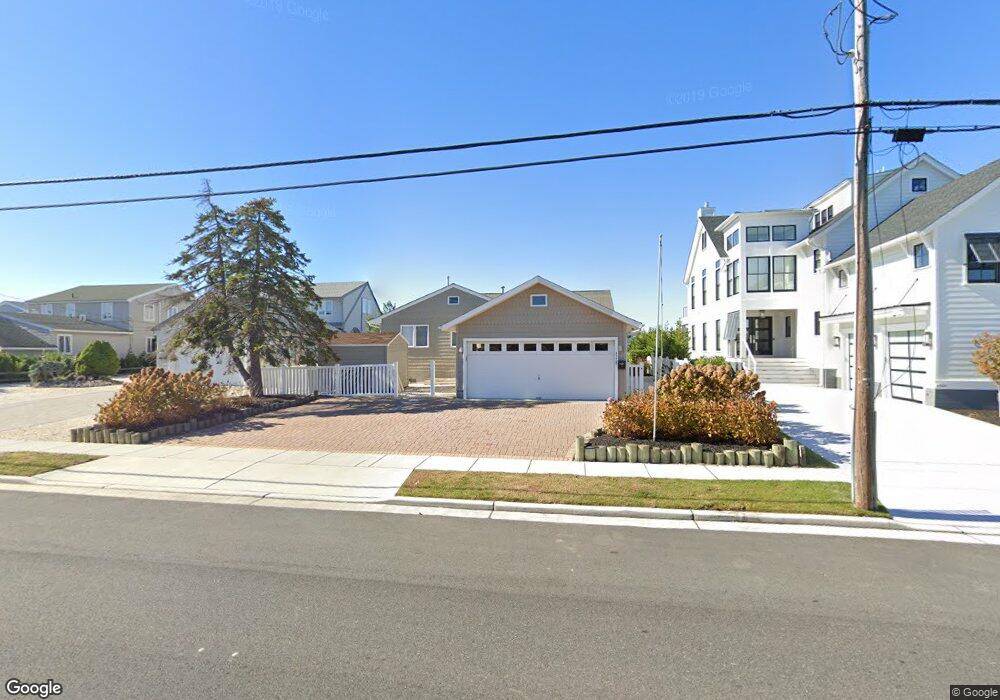
4328 Ocean Dr Avalon, NJ 08202
Estimated Value: $3,520,000 - $5,002,000
Studio
--
Bath
2,974
Sq Ft
$1,440/Sq Ft
Est. Value
About This Home
This home is located at 4328 Ocean Dr, Avalon, NJ 08202 and is currently estimated at $4,281,262, approximately $1,439 per square foot. 4328 Ocean Dr is a home located in Cape May County with nearby schools including Avalon Elementary School.
Ownership History
Date
Name
Owned For
Owner Type
Purchase Details
Closed on
Oct 12, 2011
Sold by
Hoy Richard
Bought by
43283 Ocean Drive Llc
Current Estimated Value
Purchase Details
Closed on
Oct 29, 1997
Sold by
Juska Leigh A
Bought by
Hoy Richard
Home Financials for this Owner
Home Financials are based on the most recent Mortgage that was taken out on this home.
Original Mortgage
$160,000
Interest Rate
7.23%
Purchase Details
Closed on
Apr 13, 1990
Sold by
Garrison John P and Garrison Barbara A
Bought by
Thompson Robert B and Thompson Reber,Robert
Create a Home Valuation Report for This Property
The Home Valuation Report is an in-depth analysis detailing your home's value as well as a comparison with similar homes in the area
Home Values in the Area
Average Home Value in this Area
Purchase History
| Date | Buyer | Sale Price | Title Company |
|---|---|---|---|
| 43283 Ocean Drive Llc | $1,640,000 | None Available | |
| Hoy Richard | $305,000 | -- | |
| Thompson Robert B | $780,000 | -- |
Source: Public Records
Mortgage History
| Date | Status | Borrower | Loan Amount |
|---|---|---|---|
| Previous Owner | Hoy Richard | $160,000 |
Source: Public Records
Tax History
| Year | Tax Paid | Tax Assessment Tax Assessment Total Assessment is a certain percentage of the fair market value that is determined by local assessors to be the total taxable value of land and additions on the property. | Land | Improvement |
|---|---|---|---|---|
| 2025 | $9,842 | $1,602,900 | $1,575,000 | $27,900 |
| 2024 | $9,842 | $1,602,900 | $1,575,000 | $27,900 |
| 2023 | $9,762 | $1,602,900 | $1,575,000 | $27,900 |
| 2022 | $9,104 | $1,602,900 | $1,575,000 | $27,900 |
| 2021 | $8,768 | $1,602,900 | $1,575,000 | $27,900 |
| 2020 | $8,431 | $1,602,900 | $1,575,000 | $27,900 |
| 2019 | $8,175 | $1,602,900 | $1,575,000 | $27,900 |
| 2018 | $7,822 | $1,602,900 | $1,575,000 | $27,900 |
| 2017 | $9,599 | $1,726,500 | $1,600,000 | $126,500 |
| 2016 | $9,496 | $1,726,500 | $1,600,000 | $126,500 |
| 2015 | $9,340 | $1,726,500 | $1,600,000 | $126,500 |
| 2014 | $9,237 | $1,726,500 | $1,600,000 | $126,500 |
Source: Public Records
Map
Nearby Homes
- 256 42nd St
- 264 41st St
- 4640 Ocean Dr
- 4610 4th Ave
- 198 40th St
- 253 35th St Unit WEST
- 3429 Dune Dr
- 162 33rd St
- 173 33rd St Unit 3
- 158 32nd St
- 5499 Dune Dr
- 179 32nd St
- 3149 First Ave
- 55 32nd St W Unit C2B
- 55 32nd St W
- 55 32nd St W Unit 1A
- 25 32nd St W
- 2934 Ocean Dr Unit North
- 2928 Ocean Dr Unit C-N
- 5765 Ocean Dr
Your Personal Tour Guide
Ask me questions while you tour the home.