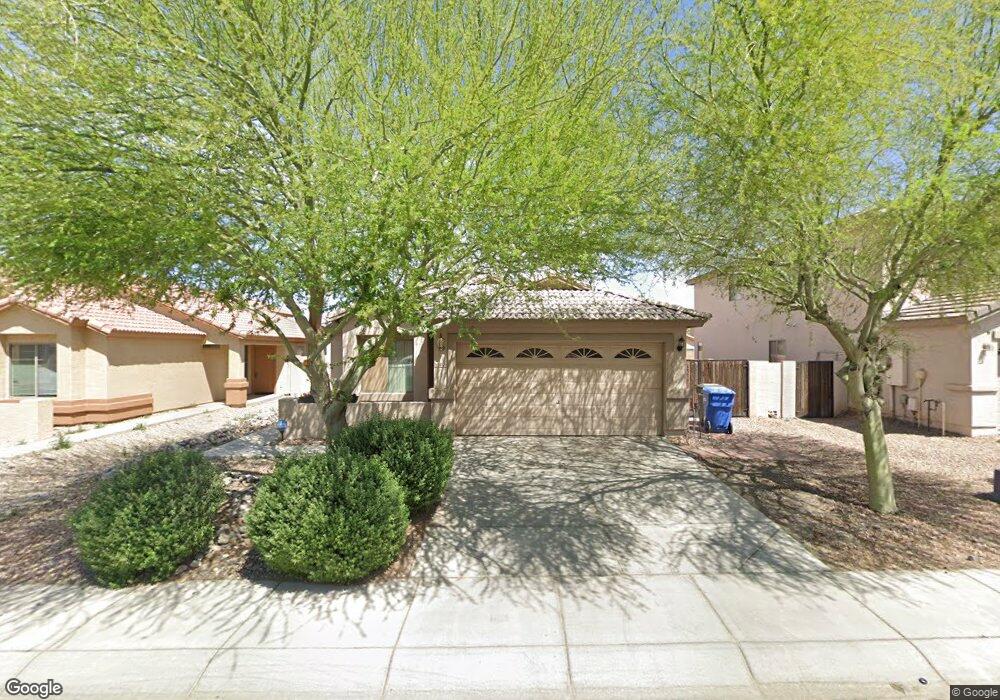
4328 W Maldonado Rd Laveen, AZ 85339
Laveen NeighborhoodEstimated Value: $305,171 - $377,000
3
Beds
2
Baths
1,533
Sq Ft
$231/Sq Ft
Est. Value
About This Home
This home is located at 4328 W Maldonado Rd, Laveen, AZ 85339 and is currently estimated at $354,793, approximately $231 per square foot. 4328 W Maldonado Rd is a home located in Maricopa County with nearby schools including Betty Fairfax High School, Phoenix Coding Academy, and Legacy Traditional School - Laveen Village.
Ownership History
Date
Name
Owned For
Owner Type
Purchase Details
Closed on
Mar 24, 2010
Sold by
Fannie Mae
Bought by
Giang Jane
Current Estimated Value
Home Financials for this Owner
Home Financials are based on the most recent Mortgage that was taken out on this home.
Original Mortgage
$98,188
Outstanding Balance
$64,751
Interest Rate
4.88%
Mortgage Type
FHA
Estimated Equity
$290,042
Purchase Details
Closed on
Jan 12, 2010
Sold by
Escobedo Celia P
Bought by
Federal National Mortgage Association
Purchase Details
Closed on
Apr 10, 2006
Sold by
Richmond American Homes Of Arizona Inc
Bought by
Escobedo Celia P
Home Financials for this Owner
Home Financials are based on the most recent Mortgage that was taken out on this home.
Original Mortgage
$156,450
Interest Rate
6.2%
Mortgage Type
New Conventional
Create a Home Valuation Report for This Property
The Home Valuation Report is an in-depth analysis detailing your home's value as well as a comparison with similar homes in the area
Home Values in the Area
Average Home Value in this Area
Purchase History
| Date | Buyer | Sale Price | Title Company |
|---|---|---|---|
| Giang Jane | $100,000 | Old Republic Title Agency | |
| Federal National Mortgage Association | $220,447 | Great American Title | |
| Escobedo Celia P | $223,521 | Fidelity National Title |
Source: Public Records
Mortgage History
| Date | Status | Borrower | Loan Amount |
|---|---|---|---|
| Open | Giang Jane | $98,188 | |
| Previous Owner | Escobedo Celia P | $156,450 |
Source: Public Records
Tax History Compared to Growth
Tax History
| Year | Tax Paid | Tax Assessment Tax Assessment Total Assessment is a certain percentage of the fair market value that is determined by local assessors to be the total taxable value of land and additions on the property. | Land | Improvement |
|---|---|---|---|---|
| 2025 | $1,616 | $11,401 | -- | -- |
| 2024 | $1,555 | $10,858 | -- | -- |
| 2023 | $1,555 | $25,850 | $5,170 | $20,680 |
| 2022 | $1,508 | $19,180 | $3,830 | $15,350 |
| 2021 | $1,520 | $17,780 | $3,550 | $14,230 |
| 2020 | $1,480 | $15,920 | $3,180 | $12,740 |
| 2019 | $1,484 | $14,370 | $2,870 | $11,500 |
| 2018 | $1,412 | $13,350 | $2,670 | $10,680 |
| 2017 | $1,335 | $11,600 | $2,320 | $9,280 |
| 2016 | $1,267 | $10,650 | $2,130 | $8,520 |
| 2015 | $1,141 | $10,080 | $2,010 | $8,070 |
Source: Public Records
Map
Nearby Homes
- 4323 W Darrel Rd
- 4335 W Apollo Rd
- 4318 W Apollo Rd
- 4332 W Carson Rd
- 4315 W Carson Rd
- 7035 S 43rd Dr
- 4352 W St Catherine Ave Unit 3
- 4320 W Alta Vista Rd
- 6915 S 46th Dr
- 4505 W Burgess Ln
- 6310 S 44th Ave
- 4409 W Dunbar Dr
- 4140 W Burgess Ln
- 4330 W T Ryan Ln Unit 2
- 4321 W Hasan Dr
- 7503 S 45th Dr
- 4639 W Burgess Ln Unit 2
- 4519 W Pleasant Ln
- 4726 W Fremont Rd
- 4745 W Fremont Rd
- 4324 W Maldonado Rd
- 4332 W Maldonado Rd Unit 3
- 4320 W Maldonado Rd Unit 3
- 4336 W Maldonado Rd
- 4327 W Darrel Rd
- 4331 W Darrel Rd
- 4319 W Darrel Rd
- 4335 W Darrel Rd
- 4340 W Maldonado Rd
- 4316 W Maldonado Rd Unit 3
- 4327 W Maldonado Rd Unit 3
- 4323 W Maldonado Rd
- 4331 W Maldonado Rd
- 4319 W Maldonado Rd Unit 3
- 4339 W Darrel Rd
- 4315 W Darrel Rd
- 4344 W Maldonado Rd Unit 3
- 4315 W Maldonado Rd
- 4339 W Maldonado Rd
- 4343 W Darrel Rd Unit 3