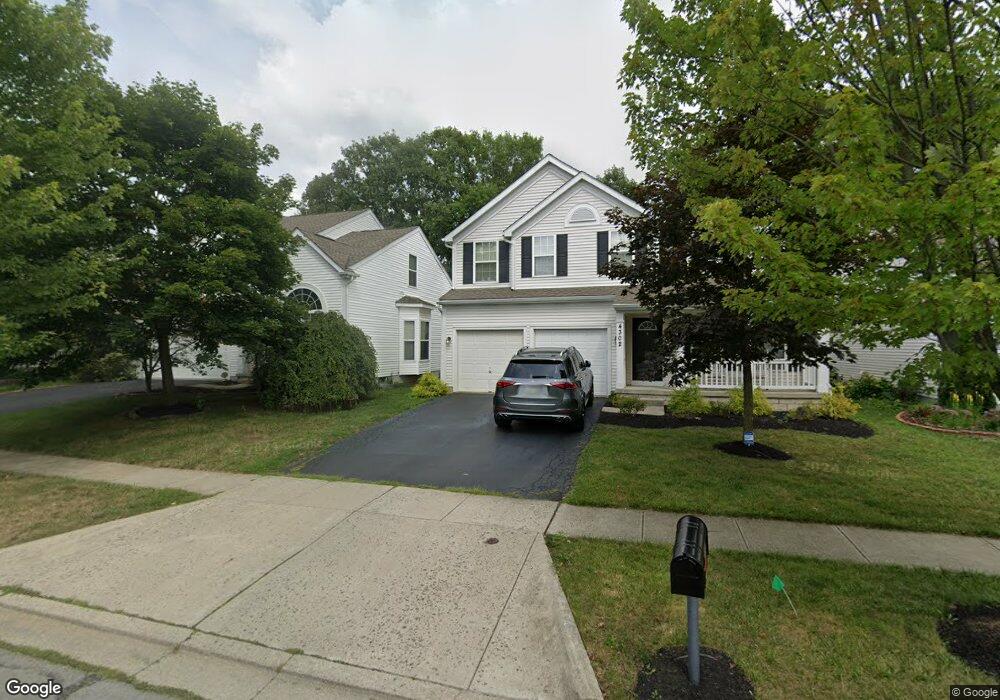
4329 Bridgeside Place Unit 18-432 New Albany, OH 43054
Preserve North NeighborhoodEstimated Value: $372,000 - $424,000
3
Beds
3
Baths
2,075
Sq Ft
$195/Sq Ft
Est. Value
About This Home
This home is located at 4329 Bridgeside Place Unit 18-432, New Albany, OH 43054 and is currently estimated at $404,794, approximately $195 per square foot. 4329 Bridgeside Place Unit 18-432 is a home located in Franklin County with nearby schools including Avalon Elementary School, Northgate Intermediate, and Woodward Park Middle School.
Ownership History
Date
Name
Owned For
Owner Type
Purchase Details
Closed on
Mar 13, 2020
Sold by
Miller Leola Gail
Bought by
Luckhaupt Erin
Current Estimated Value
Home Financials for this Owner
Home Financials are based on the most recent Mortgage that was taken out on this home.
Original Mortgage
$192,000
Outstanding Balance
$169,719
Interest Rate
3.4%
Mortgage Type
New Conventional
Estimated Equity
$235,075
Purchase Details
Closed on
Oct 24, 2019
Sold by
Miller Leola Gail and Leola Gail Miller Trust
Bought by
Miller Leola Gail
Purchase Details
Closed on
Jul 29, 2016
Sold by
Balskis Leola Gail and Miller Gail
Bought by
Miller Leola Gail and Leola Gail Miller Trust
Create a Home Valuation Report for This Property
The Home Valuation Report is an in-depth analysis detailing your home's value as well as a comparison with similar homes in the area
Home Values in the Area
Average Home Value in this Area
Purchase History
| Date | Buyer | Sale Price | Title Company |
|---|---|---|---|
| Luckhaupt Erin | $240,000 | Esquire Title Services Inc | |
| Miller Leola Gail | -- | None Available | |
| Miller Leola Gail | -- | None Available |
Source: Public Records
Mortgage History
| Date | Status | Borrower | Loan Amount |
|---|---|---|---|
| Open | Luckhaupt Erin | $192,000 |
Source: Public Records
Tax History Compared to Growth
Tax History
| Year | Tax Paid | Tax Assessment Tax Assessment Total Assessment is a certain percentage of the fair market value that is determined by local assessors to be the total taxable value of land and additions on the property. | Land | Improvement |
|---|---|---|---|---|
| 2024 | $5,683 | $126,630 | $24,850 | $101,780 |
| 2023 | $5,611 | $126,630 | $24,850 | $101,780 |
| 2022 | $4,233 | $81,620 | $12,950 | $68,670 |
| 2021 | $4,241 | $81,620 | $12,950 | $68,670 |
| 2020 | $4,246 | $81,620 | $12,950 | $68,670 |
| 2019 | $4,134 | $68,150 | $8,930 | $59,220 |
| 2018 | $3,725 | $68,150 | $8,930 | $59,220 |
| 2017 | $3,896 | $68,150 | $8,930 | $59,220 |
| 2016 | $3,661 | $55,270 | $8,300 | $46,970 |
| 2015 | $3,324 | $55,270 | $8,300 | $46,970 |
| 2014 | $3,332 | $55,270 | $8,300 | $46,970 |
| 2013 | $1,643 | $55,265 | $8,295 | $46,970 |
Source: Public Records
Map
Nearby Homes
- 4331 Bridgeside Place
- 4185 Windsor Bridge Place Unit 44185
- 6214 Brickside Dr Unit 24
- 4062 Summerstone Dr
- 4135 Pathfield Dr
- 4083 Parkcove Dr Unit 23A
- 4063 Parkcove Dr Unit 21A
- 4038 Blendon Point Dr Unit 57C
- 4079 Blendon Point Dr Unit 62B
- 4100 Blendon Way Dr Unit 98D
- 6439 Lake Mathias Dr
- 5656 Beaver Head Ct
- 6232 Joes Hopper Rd Unit 52
- 3977 Spectacle Dr
- 4338 Big Sky Ct
- 6169 Needletail Rd
- 5832 Albany Grove Unit 5832
- 6000 Bentgate Ln
- 6335 Hares Ear Dr Unit 30
- 6200 Downwing Ln Unit 20
- 4335 Bridgeside Place Unit 18
- 4335 Bridgeside Place
- 4333 Bridgeside Place
- 4319 Bridgeside Place
- 4318 Greensbury Dr
- 4313 Bridgeside Place
- 4302 Greensbury Dr
- 4310 Greensbury Dr
- 4347 Bridgeside Place Unit 19
- 4347 Bridgeside Place
- 4315 Bridgeside Place
- 4349 Bridgeside Place Unit 19-434
- 4349 Bridgeside Place
- 4294 Greensbury Dr
- 4330 Bridgeside Place Unit 32-433
- 4330 Bridgeside Place
- 4334 Greensbury Dr
- 4301 Bridgeside Place
- 4293 Bridgelane Place Unit 2-4293
- 4278 Greensbury Dr