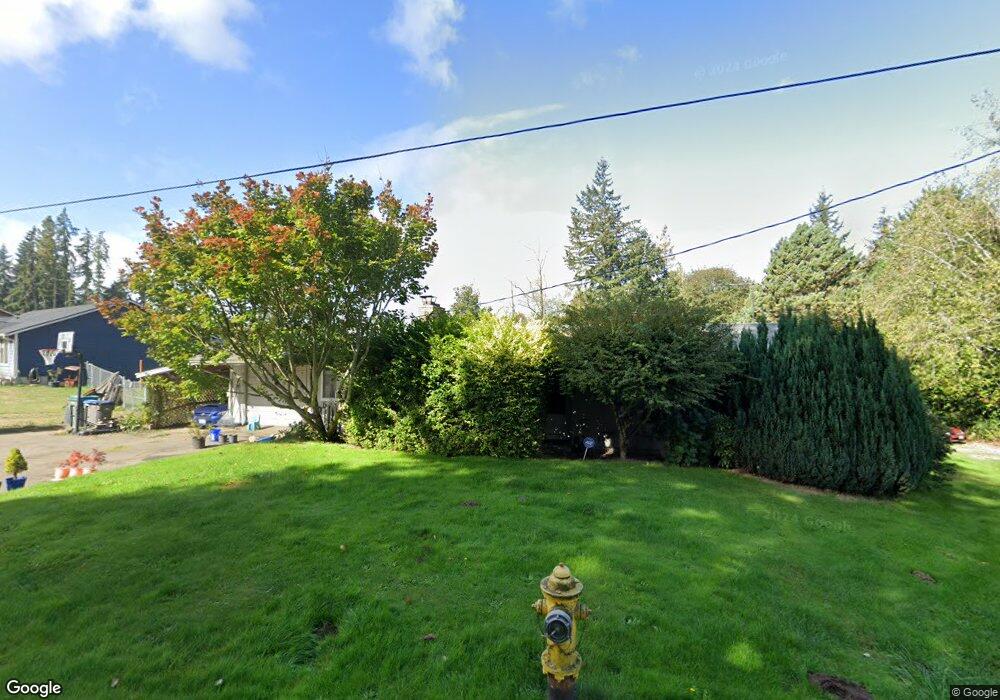
4329 SE Horstman Rd Port Orchard, WA 98366
Estimated Value: $405,000 - $454,000
3
Beds
1
Bath
1,192
Sq Ft
$354/Sq Ft
Est. Value
About This Home
This home is located at 4329 SE Horstman Rd, Port Orchard, WA 98366 and is currently estimated at $422,392, approximately $354 per square foot. 4329 SE Horstman Rd is a home with nearby schools including Orchard Heights Elementary School, Marcus Whitman Middle School, and South Kitsap High School.
Ownership History
Date
Name
Owned For
Owner Type
Purchase Details
Closed on
Apr 14, 1998
Sold by
Peterson Iain K I
Bought by
Peterson Iain K I and Peterson Holly
Current Estimated Value
Home Financials for this Owner
Home Financials are based on the most recent Mortgage that was taken out on this home.
Original Mortgage
$90,556
Outstanding Balance
$17,130
Interest Rate
7.06%
Mortgage Type
FHA
Estimated Equity
$405,262
Purchase Details
Closed on
Sep 27, 1995
Sold by
Duncan James L and Pedersen Thelma L
Bought by
Peterson Iain K I
Home Financials for this Owner
Home Financials are based on the most recent Mortgage that was taken out on this home.
Original Mortgage
$86,850
Interest Rate
7.97%
Mortgage Type
FHA
Create a Home Valuation Report for This Property
The Home Valuation Report is an in-depth analysis detailing your home's value as well as a comparison with similar homes in the area
Home Values in the Area
Average Home Value in this Area
Purchase History
| Date | Buyer | Sale Price | Title Company |
|---|---|---|---|
| Peterson Iain K I | -- | Charter Title Corporation | |
| Peterson Iain K I | $79,500 | Charter Title Corp |
Source: Public Records
Mortgage History
| Date | Status | Borrower | Loan Amount |
|---|---|---|---|
| Open | Peterson Iain K I | $90,556 | |
| Closed | Peterson Iain K I | $86,850 | |
| Closed | Peterson Iain K I | $5,000 |
Source: Public Records
Tax History Compared to Growth
Tax History
| Year | Tax Paid | Tax Assessment Tax Assessment Total Assessment is a certain percentage of the fair market value that is determined by local assessors to be the total taxable value of land and additions on the property. | Land | Improvement |
|---|---|---|---|---|
| 2026 | $3,221 | $363,270 | $82,160 | $281,110 |
| 2025 | $3,221 | $363,270 | $82,160 | $281,110 |
| 2024 | $3,124 | $363,270 | $82,160 | $281,110 |
| 2023 | $3,103 | $363,270 | $82,160 | $281,110 |
| 2022 | $2,969 | $291,060 | $65,860 | $225,200 |
| 2021 | $2,857 | $265,050 | $62,720 | $202,330 |
| 2020 | $2,447 | $219,290 | $55,940 | $163,350 |
| 2019 | $2,112 | $207,200 | $52,760 | $154,440 |
| 2018 | $2,207 | $174,610 | $54,940 | $119,670 |
| 2017 | $1,958 | $174,610 | $54,940 | $119,670 |
| 2016 | $1,931 | $157,670 | $54,940 | $102,730 |
| 2015 | $1,872 | $155,000 | $54,940 | $100,060 |
| 2014 | -- | $152,320 | $54,940 | $97,380 |
| 2013 | -- | $150,310 | $57,830 | $92,480 |
Source: Public Records
Map
Nearby Homes
- 4258 SE Woodford Ct
- 1400 Baby Doll Rd SE
- 4010 SE Lovell St
- 3930 SE Mile Hill Dr
- 3900 SE Mile Hill Dr
- 1663 Harrison Ave SE
- 740 Tufts Ave E
- 0 Wendell Ave SE
- 3884 Madrona Dr SE
- 1242 Lidstrom Rd E
- 824 Cherub Place E
- 1200 Baby Doll Rd E
- 2014 Kelowna Place SE
- 1560 Woodridge Dr SE
- 2169 Ponderosa Dr SE
- 5101 SE Natchez Ct
- 4898 E Collins Rd
- 2017 SE Juniper Ct
- 1355 Ahlstrom Rd E
- 1135 Hillandale Dr E
- 4299 SE Horstman Rd
- 4391 SE Horstman Rd
- 4393 SE Horstman Rd
- 771 SE Olga Cir
- 779 SE Olga Cir
- 4320 SE Horstman Rd
- 763 SE Olga Cir
- 4350 SE Horstman Rd
- 787 SE Olga Cir
- 755 SE Olga Circles
- 755 SE Olga Cir
- 795 SE Olga Cir
- 747 SE Olga Cir
- 4388 SE Horstman Rd
- 4290 SE Horstman Rd
- 739 SE Olga Cir
- 731 SE Olga Cir
- 4397 SE Horstman Rd
- 4395 SE Horstman Rd
- 723 SE Olga Cir