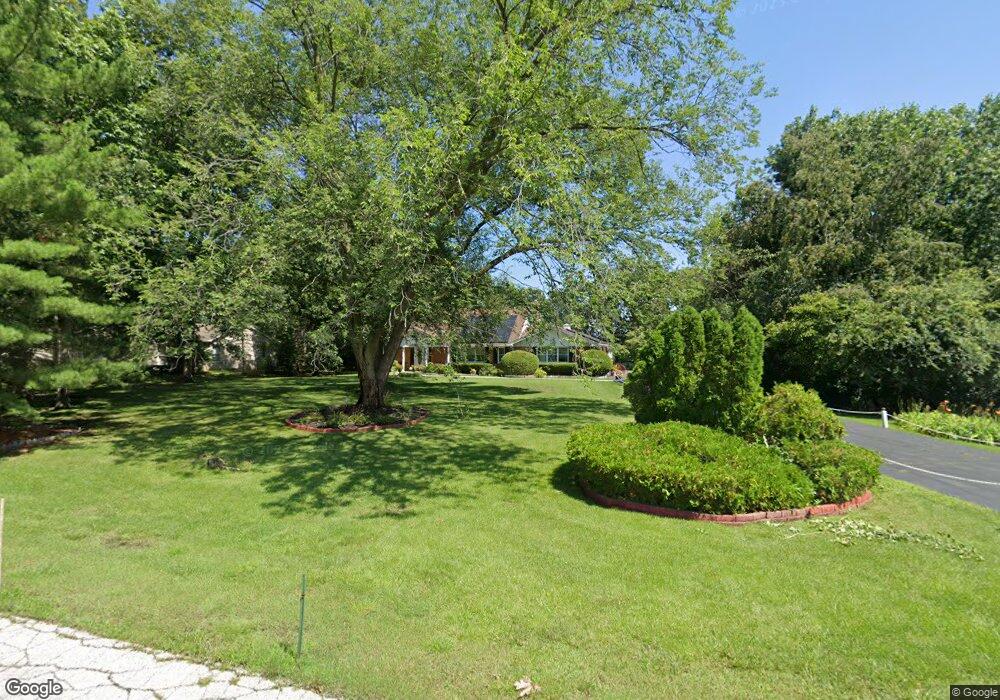
43295 N Oak Crest Ln Zion, IL 60099
West Zion NeighborhoodEstimated Value: $346,832 - $401,000
4
Beds
3
Baths
2,106
Sq Ft
$178/Sq Ft
Est. Value
About This Home
This home is located at 43295 N Oak Crest Ln, Zion, IL 60099 and is currently estimated at $375,458, approximately $178 per square foot. 43295 N Oak Crest Ln is a home located in Lake County with nearby schools including Newport Elementary School, Beach Park Middle School, and Zion-Benton Township High School.
Ownership History
Date
Name
Owned For
Owner Type
Purchase Details
Closed on
Jan 11, 2020
Sold by
Jones Sylvester and Jones Ida
Bought by
Jones Sylvester and Blachard Jones Ida
Current Estimated Value
Home Financials for this Owner
Home Financials are based on the most recent Mortgage that was taken out on this home.
Original Mortgage
$251,903
Outstanding Balance
$222,566
Interest Rate
3.6%
Mortgage Type
VA
Estimated Equity
$152,892
Purchase Details
Closed on
Aug 5, 1994
Sold by
Jones Sylvester
Bought by
Jones Sylvester and Jones Ida
Purchase Details
Closed on
Sep 9, 1993
Sold by
Roe Edward R and Roe Judith H
Bought by
Jones Sylvester
Home Financials for this Owner
Home Financials are based on the most recent Mortgage that was taken out on this home.
Original Mortgage
$171,000
Interest Rate
8.48%
Create a Home Valuation Report for This Property
The Home Valuation Report is an in-depth analysis detailing your home's value as well as a comparison with similar homes in the area
Home Values in the Area
Average Home Value in this Area
Purchase History
| Date | Buyer | Sale Price | Title Company |
|---|---|---|---|
| Jones Sylvester | -- | Attorney | |
| Jones Sylvester | -- | -- | |
| Jones Sylvester | $190,000 | First American Title |
Source: Public Records
Mortgage History
| Date | Status | Borrower | Loan Amount |
|---|---|---|---|
| Open | Jones Sylvester | $251,903 | |
| Previous Owner | Jones Sylvester | $171,000 |
Source: Public Records
Tax History Compared to Growth
Tax History
| Year | Tax Paid | Tax Assessment Tax Assessment Total Assessment is a certain percentage of the fair market value that is determined by local assessors to be the total taxable value of land and additions on the property. | Land | Improvement |
|---|---|---|---|---|
| 2024 | $7,482 | $99,314 | $14,112 | $85,202 |
| 2023 | $7,278 | $92,327 | $13,623 | $78,704 |
| 2022 | $7,278 | $84,069 | $13,276 | $70,793 |
| 2021 | $7,491 | $81,930 | $12,938 | $68,992 |
| 2020 | $7,297 | $78,185 | $12,347 | $65,838 |
| 2019 | $7,263 | $74,179 | $11,714 | $62,465 |
| 2018 | $7,863 | $77,213 | $14,159 | $63,054 |
| 2017 | $7,783 | $72,637 | $13,320 | $59,317 |
| 2016 | $7,545 | $69,152 | $12,681 | $56,471 |
| 2015 | $7,253 | $63,419 | $11,630 | $51,789 |
| 2014 | $8,311 | $75,054 | $10,930 | $64,124 |
| 2012 | $8,530 | $77,994 | $11,358 | $66,636 |
Source: Public Records
Map
Nearby Homes
- 43389 N Oakcrest Ln
- 43411 Lynn Dale Dr
- 0 9th St
- Lt0 128th St
- 908 Countrywood Dr
- 12977 W 9th St
- 42908 N Lewis Ave
- 4401 122nd St
- 43100 N Lewis Ave
- Lt0 39th Ave
- 1302 Lorelei Dr
- 11449 61st Ave
- 3717 Willow Crest Dr
- Lt5 113th St
- 3707 Willow Crest Dr
- 429 Megan Place
- 1304 Pelican Ct
- Lt6 113th St
- 1417 Westside Trail
- 4014 Ridge Rd
- 43269 N Oak Crest Ln
- 43323 N Oak Crest Ln
- 43294 N Oak Crest Ln
- 43361 N Oak Crest Ln
- 43268 N Oak Crest Ln
- 43322 N Oak Crest Ln
- 43322 N Oakcrest Ln
- 43360 N Oak Crest Ln
- 43389 N Oak Crest Ln
- 43388 N Oak Crest Ln
- 12647 W Russell Rd
- 12713 W Russell Rd
- 12769 W Russell Rd
- 12825 W Russell Rd
- 12247 W Russell Rd
- 12881 W Russell Rd
- 43321 N Lynndale Dr
- 43367 N Lynndale Dr
- 43411 N Lynndale Dr
- 43465 N Lynndale Dr