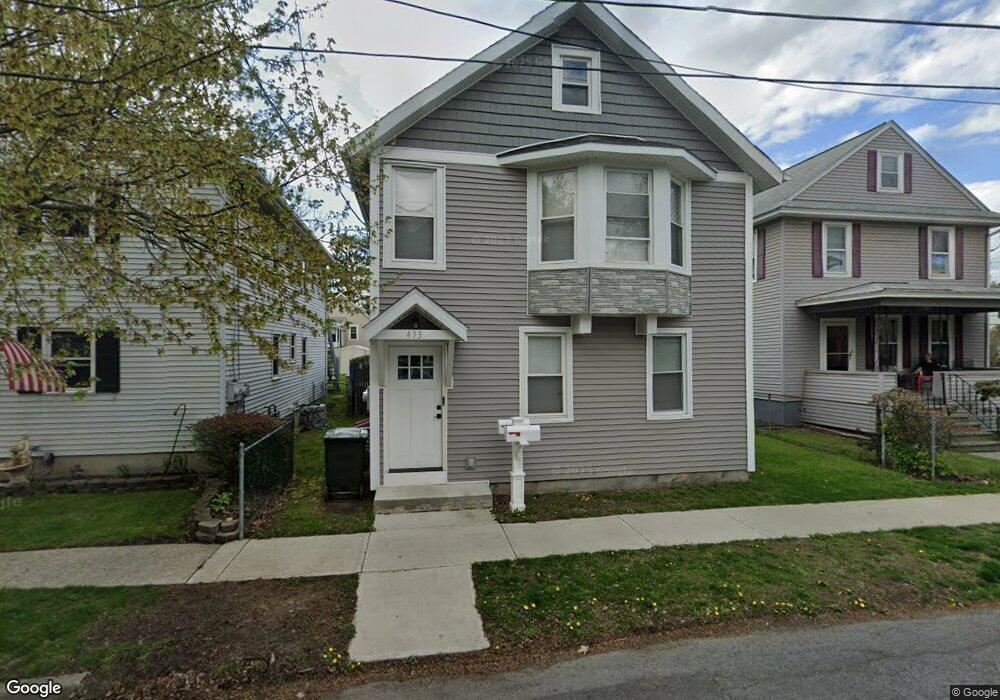
433 5th Ave Watervliet, NY 12189
Estimated Value: $188,000 - $222,797
3
Beds
2
Baths
1,400
Sq Ft
$145/Sq Ft
Est. Value
About This Home
This home is located at 433 5th Ave, Watervliet, NY 12189 and is currently estimated at $203,449, approximately $145 per square foot. 433 5th Ave is a home located in Albany County with nearby schools including Watervliet Elementary School and Watervliet Junior/Senior High School.
Ownership History
Date
Name
Owned For
Owner Type
Purchase Details
Closed on
May 2, 2022
Sold by
Rezey Michael N
Bought by
Si Quick Llc
Current Estimated Value
Purchase Details
Closed on
May 17, 2006
Sold by
Cecchetto Mary Anne
Bought by
Rezey Michael
Home Financials for this Owner
Home Financials are based on the most recent Mortgage that was taken out on this home.
Original Mortgage
$87,600
Interest Rate
6.71%
Create a Home Valuation Report for This Property
The Home Valuation Report is an in-depth analysis detailing your home's value as well as a comparison with similar homes in the area
Home Values in the Area
Average Home Value in this Area
Purchase History
| Date | Buyer | Sale Price | Title Company |
|---|---|---|---|
| Si Quick Llc | $110,000 | None Listed On Document | |
| Rezey Michael | $109,500 | Flint | |
| Rezey Michael Nahan | $109,500 | None Available |
Source: Public Records
Mortgage History
| Date | Status | Borrower | Loan Amount |
|---|---|---|---|
| Previous Owner | Rezey Michael Nahan | $87,600 | |
| Previous Owner | Rezey Michael | $21,900 |
Source: Public Records
Tax History Compared to Growth
Tax History
| Year | Tax Paid | Tax Assessment Tax Assessment Total Assessment is a certain percentage of the fair market value that is determined by local assessors to be the total taxable value of land and additions on the property. | Land | Improvement |
|---|---|---|---|---|
| 2024 | $3,853 | $106,400 | $28,500 | $77,900 |
| 2023 | $3,825 | $106,400 | $28,500 | $77,900 |
| 2022 | $3,702 | $106,400 | $28,500 | $77,900 |
| 2021 | $3,666 | $106,400 | $28,500 | $77,900 |
| 2020 | $3,579 | $106,400 | $28,500 | $77,900 |
| 2019 | $3,301 | $106,400 | $28,500 | $77,900 |
| 2018 | $3,514 | $106,400 | $28,500 | $77,900 |
| 2017 | $3,346 | $106,400 | $28,500 | $77,900 |
| 2016 | $3,177 | $106,400 | $28,500 | $77,900 |
| 2015 | -- | $120,200 | $28,500 | $91,700 |
| 2014 | -- | $120,200 | $28,500 | $91,700 |
Source: Public Records
Map
Nearby Homes