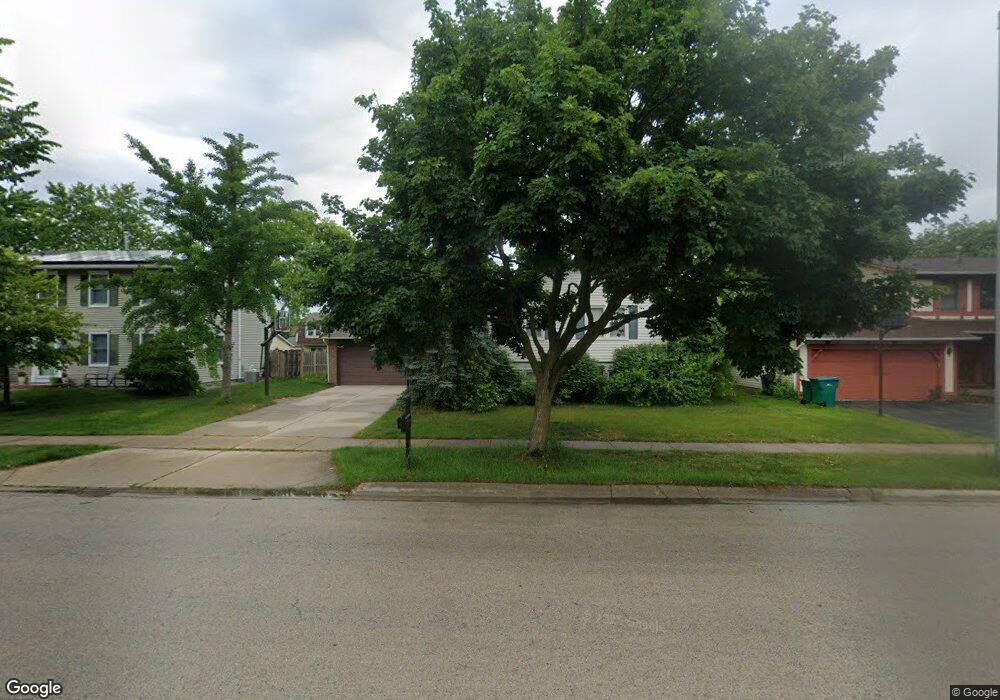
433 Armstrong Dr Buffalo Grove, IL 60089
Estimated Value: $467,121 - $541,000
--
Bed
3
Baths
1,428
Sq Ft
$355/Sq Ft
Est. Value
About This Home
This home is located at 433 Armstrong Dr, Buffalo Grove, IL 60089 and is currently estimated at $507,030, approximately $355 per square foot. 433 Armstrong Dr is a home located in Lake County with nearby schools including Meridian Middle School, Earl Pritchett School, and Aptakisic Junior High School.
Ownership History
Date
Name
Owned For
Owner Type
Purchase Details
Closed on
Jan 22, 2002
Sold by
Feiger James M and Feiger Deborah P
Bought by
Kim Insup and Kim Stephanie S
Current Estimated Value
Home Financials for this Owner
Home Financials are based on the most recent Mortgage that was taken out on this home.
Original Mortgage
$195,000
Outstanding Balance
$80,253
Interest Rate
7.14%
Estimated Equity
$426,777
Purchase Details
Closed on
Sep 25, 1998
Sold by
Crowley Paul J and Crowley Gertrude A
Bought by
Feiger James M and Feiger Deborah P
Home Financials for this Owner
Home Financials are based on the most recent Mortgage that was taken out on this home.
Original Mortgage
$145,000
Interest Rate
6.97%
Purchase Details
Closed on
Oct 3, 1994
Sold by
Oh Changsung and Oh Michael C
Bought by
Crowley Paul J and Crowley Gertrude A
Home Financials for this Owner
Home Financials are based on the most recent Mortgage that was taken out on this home.
Original Mortgage
$168,000
Interest Rate
6%
Create a Home Valuation Report for This Property
The Home Valuation Report is an in-depth analysis detailing your home's value as well as a comparison with similar homes in the area
Home Values in the Area
Average Home Value in this Area
Purchase History
| Date | Buyer | Sale Price | Title Company |
|---|---|---|---|
| Kim Insup | $303,000 | -- | |
| Feiger James M | $205,000 | Chicago Title Insurance Co | |
| Crowley Paul J | $210,000 | -- |
Source: Public Records
Mortgage History
| Date | Status | Borrower | Loan Amount |
|---|---|---|---|
| Open | Kim Insup | $195,000 | |
| Previous Owner | Feiger James M | $145,000 | |
| Previous Owner | Crowley Paul J | $168,000 |
Source: Public Records
Tax History Compared to Growth
Tax History
| Year | Tax Paid | Tax Assessment Tax Assessment Total Assessment is a certain percentage of the fair market value that is determined by local assessors to be the total taxable value of land and additions on the property. | Land | Improvement |
|---|---|---|---|---|
| 2024 | $12,896 | $141,179 | $26,778 | $114,401 |
| 2023 | $12,000 | $133,213 | $25,267 | $107,946 |
| 2022 | $12,000 | $128,831 | $24,436 | $104,395 |
| 2021 | $11,574 | $127,442 | $24,173 | $103,269 |
| 2020 | $11,349 | $127,876 | $24,255 | $103,621 |
| 2019 | $11,049 | $127,405 | $24,166 | $103,239 |
| 2018 | $10,075 | $116,521 | $23,885 | $92,636 |
| 2017 | $9,942 | $113,801 | $23,327 | $90,474 |
| 2016 | $9,592 | $108,973 | $22,337 | $86,636 |
| 2015 | $9,394 | $101,910 | $20,889 | $81,021 |
| 2014 | $8,388 | $90,671 | $22,434 | $68,237 |
| 2012 | $8,328 | $90,853 | $22,479 | $68,374 |
Source: Public Records
Map
Nearby Homes
- 473 Le Parc Cir Unit 126
- 220 Osage Ln
- 1239 Oboe Ct Unit 33
- 1242 Nova Ct Unit 24
- 1050 Driftwood Ct Unit 1
- 588 Fairway View Dr Unit 2E
- 586 Fairway View Dr Unit 1A
- 550 Greystone Ln Unit A2
- 20665 N Weiland Rd
- 1059 Southbury Ln Unit 1
- 640 Mchenry Rd Unit 301
- 1142 Inverrary Ln Unit D-86
- 25 Crestview Terrace
- 823 Cambridge Place Unit 119
- 36 Crestview Terrace
- 232 Manor Dr Unit 12C
- 690 Dunhill Dr
- 381 Bentley Place
- 1500 Canbury Ct Unit 11373
- 928 Woodland Dr
- 421 Armstrong Dr
- 445 Armstrong Dr
- 432 Chicory Ln
- 420 Chicory Ln
- 457 Armstrong Dr
- 409 Armstrong Dr
- 408 Chicory Ln
- 469 Armstrong Dr
- 397 Armstrong Dr
- 99 Le Jardin Ct Unit G3
- 99 Le Jardin Ct Unit 3
- 97 Le Jardin Ct Unit G4
- 101 Le Jardin Ct Unit G2
- 396 Chicory Ln
- 95 Le Jardin Ct Unit G5
- 456 Chicory Ln
- 93 Le Jardin Ct Unit G6
- 91 Le Jardin Ct Unit G1
- 91 Le Jardin Ct Unit 1
- 481 Armstrong Dr