Estimated Value: $316,000 - $392,599
2
Beds
1
Bath
1,093
Sq Ft
$322/Sq Ft
Est. Value
About This Home
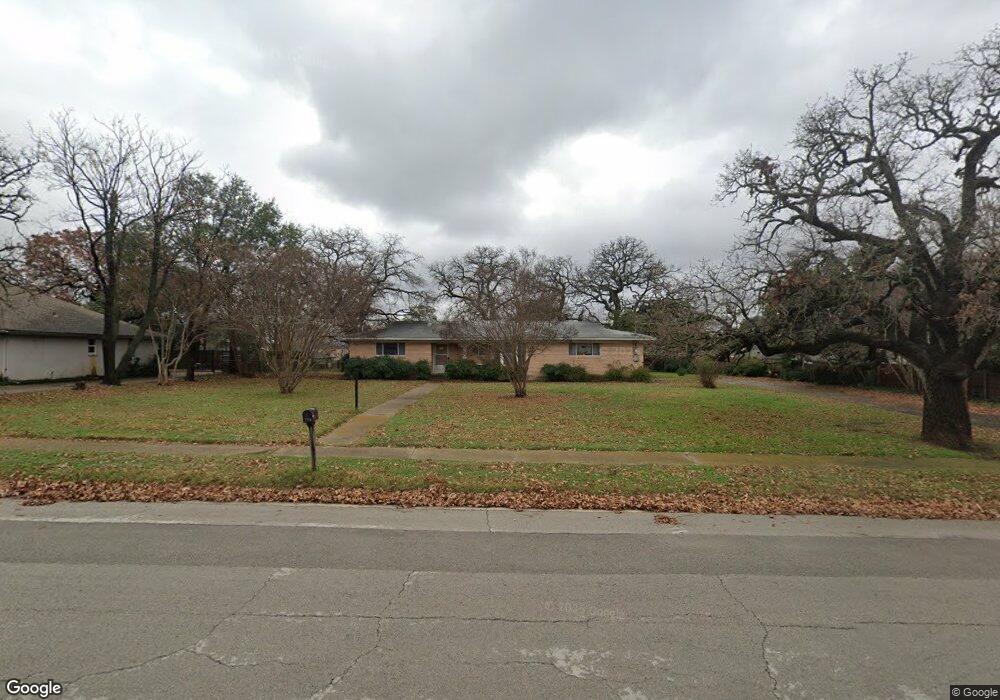
This home is located at 433 Cannon Dr, Hurst, TX 76054 and is currently estimated at $352,400, approximately $322 per square foot. 433 Cannon Dr is a home located in Tarrant County with nearby schools including Shady Oaks Elementary School, Bedford Junior High School, and L.D. Bell High School.
Ownership History
Date
Name
Owned For
Owner Type
Purchase Details
Closed on
Oct 5, 2006
Sold by
Noe P Lyn
Bought by
Kleven Lowell E and Kleven Sharon L
Current Estimated Value
Home Financials for this Owner
Home Financials are based on the most recent Mortgage that was taken out on this home.
Original Mortgage
$89,775
Interest Rate
6.47%
Mortgage Type
Purchase Money Mortgage
Purchase Details
Closed on
Aug 18, 2006
Sold by
Hanks Kathy
Bought by
Noe P Lyn
Home Financials for this Owner
Home Financials are based on the most recent Mortgage that was taken out on this home.
Original Mortgage
$89,775
Interest Rate
6.47%
Mortgage Type
Purchase Money Mortgage
Purchase Details
Closed on
Mar 28, 1995
Sold by
Cannon Sallie E and Cannon Dennis E
Bought by
Hanks Kathy and Hanks Noe P
Home Financials for this Owner
Home Financials are based on the most recent Mortgage that was taken out on this home.
Original Mortgage
$89,775
Interest Rate
8.72%
Mortgage Type
FHA
Create a Home Valuation Report for This Property
The Home Valuation Report is an in-depth analysis detailing your home's value as well as a comparison with similar homes in the area
Home Values in the Area
Average Home Value in this Area
Purchase History
| Date | Buyer | Sale Price | Title Company |
|---|---|---|---|
| Kleven Lowell E | -- | American Title | |
| Noe P Lyn | -- | American Title | |
| Hanks Kathy | -- | American Title Company |
Source: Public Records
Mortgage History
| Date | Status | Borrower | Loan Amount |
|---|---|---|---|
| Previous Owner | Noe P Lyn | $89,775 | |
| Previous Owner | Hanks Kathy | $89,775 |
Source: Public Records
Tax History
| Year | Tax Paid | Tax Assessment Tax Assessment Total Assessment is a certain percentage of the fair market value that is determined by local assessors to be the total taxable value of land and additions on the property. | Land | Improvement |
|---|---|---|---|---|
| 2025 | $7,130 | $336,000 | $225,000 | $111,000 |
| 2024 | $7,130 | $349,078 | $225,000 | $124,078 |
| 2023 | $7,126 | $355,696 | $165,000 | $190,696 |
| 2022 | $7,319 | $317,899 | $165,000 | $152,899 |
| 2021 | $6,222 | $258,000 | $165,000 | $93,000 |
| 2020 | $6,207 | $258,000 | $165,000 | $93,000 |
| 2019 | $6,412 | $262,000 | $165,000 | $97,000 |
| 2018 | $6,388 | $261,000 | $165,000 | $96,000 |
| 2017 | $4,108 | $162,352 | $54,000 | $108,352 |
| 2016 | $2,761 | $109,100 | $54,000 | $55,100 |
| 2015 | $2,861 | $109,100 | $51,000 | $58,100 |
| 2014 | $2,861 | $109,100 | $51,000 | $58,100 |
Source: Public Records
Map
Nearby Homes
- 421 Cavender Ct
- 404 Mountainview Dr
- 2204 Mountainview Dr
- 317 Northglen Dr
- 2157 Lookout Ct
- 227 Norwich Dr
- 1913 Yucca Trail
- 2221 Farrington Ln
- 2244 Hurstview Dr
- 1905 Cimarron Trail
- 440 W Louella Dr
- 600 Circleview Dr N
- 612 Circleview Dr S
- 3006 Carolyn Ct
- 201 Hillview Dr
- 1625 Oak Creek Dr
- 305 Warbler Dr
- 137 E Louella Dr
- 532 Plainview Dr
- 2620 Brookridge Dr
- 421 Cannon Dr
- 2028 Mountainview Dr
- 2032 Mountainview Dr
- 2024 Mountainview Dr
- 420 Cavender Ct
- 417 Cannon Dr
- 416 Cavender Ct
- 2101 Cambridge Dr
- 2020 Mountainview Dr
- 420 Cannon Dr
- 413 Cannon Dr
- 416 Cannon Dr
- 2100 Mountainview Dr
- 2016 Mountainview Dr
- 412 Cavender Ct
- 2105 Cambridge Dr
- 2029 Mountainview Dr
- 2033 Mountainview Dr
- 417 Cavender Ct
- 412 Cannon Dr
Your Personal Tour Guide
Ask me questions while you tour the home.