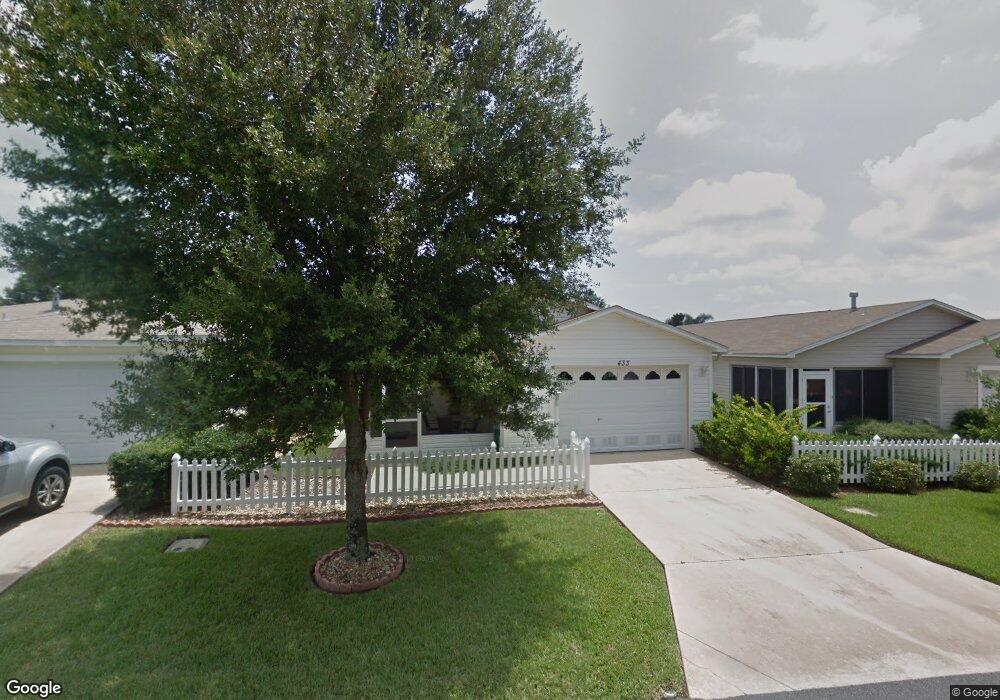
433 Canterbury Ct The Villages, FL 32162
Village of Belvedere NeighborhoodEstimated Value: $277,000 - $290,000
--
Bed
--
Bath
1,188
Sq Ft
$238/Sq Ft
Est. Value
About This Home
This home is located at 433 Canterbury Ct, The Villages, FL 32162 and is currently estimated at $282,186, approximately $237 per square foot. 433 Canterbury Ct is a home located in Sumter County with nearby schools including Wildwood Elementary School, Wildwood Middle/High School, and Villages Charter School.
Ownership History
Date
Name
Owned For
Owner Type
Purchase Details
Closed on
Sep 26, 2023
Sold by
Sacco Joyce A
Bought by
Kruse Jayme
Current Estimated Value
Purchase Details
Closed on
Mar 21, 2019
Sold by
Blubaugh Walter L and Blubaugh Carol J
Bought by
Sacco George J and Sacco Joyce A
Purchase Details
Closed on
Oct 4, 2010
Sold by
White William J and White Virginia F
Bought by
Blubaugh Walter L and Blubaugh Carol J
Purchase Details
Closed on
Apr 26, 2004
Sold by
The Villages Of Lake Sumter Inc
Bought by
White William J and White Virginia F
Home Financials for this Owner
Home Financials are based on the most recent Mortgage that was taken out on this home.
Original Mortgage
$52,600
Interest Rate
4.7%
Mortgage Type
Purchase Money Mortgage
Create a Home Valuation Report for This Property
The Home Valuation Report is an in-depth analysis detailing your home's value as well as a comparison with similar homes in the area
Home Values in the Area
Average Home Value in this Area
Purchase History
| Date | Buyer | Sale Price | Title Company |
|---|---|---|---|
| Kruse Jayme | $299,000 | Peninsula Land & Title | |
| Kruse Jayme | $299,000 | Peninsula Land & Title | |
| Sacco George J | $196,500 | Peninsula Land & Title | |
| Blubaugh Walter L | $124,000 | Attorney | |
| White William J | $118,300 | -- |
Source: Public Records
Mortgage History
| Date | Status | Borrower | Loan Amount |
|---|---|---|---|
| Previous Owner | White William J | $52,600 |
Source: Public Records
Tax History Compared to Growth
Tax History
| Year | Tax Paid | Tax Assessment Tax Assessment Total Assessment is a certain percentage of the fair market value that is determined by local assessors to be the total taxable value of land and additions on the property. | Land | Improvement |
|---|---|---|---|---|
| 2025 | $2,544 | $229,100 | $23,920 | $205,180 |
| 2024 | $2,545 | $234,010 | $23,920 | $210,090 |
| 2023 | $2,545 | $231,010 | $15,950 | $215,060 |
| 2022 | $2,309 | $204,730 | $15,910 | $188,820 |
| 2021 | $2,193 | $159,530 | $15,910 | $143,620 |
| 2020 | $2,354 | $161,610 | $11,960 | $149,650 |
| 2019 | $2,351 | $163,370 | $11,960 | $151,410 |
| 2018 | $1,942 | $137,820 | $11,960 | $125,860 |
| 2017 | $2,012 | $139,270 | $11,960 | $127,310 |
| 2016 | $2,019 | $140,710 | $0 | $0 |
| 2015 | $2,003 | $140,600 | $0 | $0 |
| 2014 | $1,885 | $123,610 | $0 | $0 |
Source: Public Records
Map
Nearby Homes
- 428 Canterbury Ct
- 420 Canterbury Ct
- 408 Rose Croft Terrace
- 2690 Suffolk St
- 2670 Suffolk St
- 2627 Ascot Loop
- 2757 Plainridge Loop
- 2879 Remington Rd
- 2446 Kenmore Ln
- 670 Fayette Ct
- 2762 Morven Park Way
- 616 Hartford Ln
- 560 Smithfield Place
- 610 Danbury St
- 720 Alcott Ave
- 2746 Edwards Ln
- 2415 Morven Park Way
- 776 Alcott Ave
- 5087 NE 121st Ave
- 2475 Laurel Bay Ln
- 429 Canterbury Ct
- 437 Canterbury Ct
- 425 Canterbury Ct
- 436 Maywood Way
- 421 Canterbury Ct
- 432 Canterbury Ct
- 443 Canterbury Ct
- 440 Maywood Way
- 441 Canterbury Ct
- 436 Canterbury Ct
- 444 Maywood Way
- 440 Canterbury Ct
- 424 Canterbury Ct
- 417 Canterbury Ct
- 445 Canterbury Ct
- 448 Maywood Way
- 444 Canterbury Ct
- 413 Canterbury Ct
- 452 Maywood Way