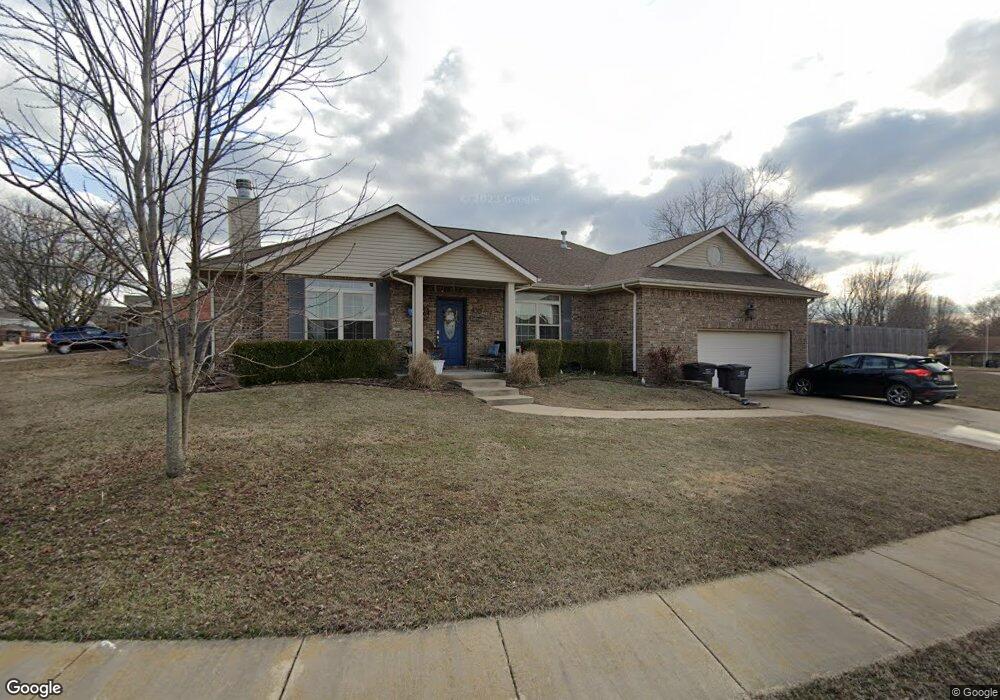
433 Chisholm Cir Bartlesville, OK 74006
Estimated Value: $251,000 - $310,000
3
Beds
2
Baths
2,370
Sq Ft
$116/Sq Ft
Est. Value
About This Home
This home is located at 433 Chisholm Cir, Bartlesville, OK 74006 and is currently estimated at $273,807, approximately $115 per square foot. 433 Chisholm Cir is a home located in Washington County with nearby schools including Hoover Elementary School, Madison Middle School, and Bartlesville High School.
Ownership History
Date
Name
Owned For
Owner Type
Purchase Details
Closed on
May 27, 2011
Sold by
Brookfield Global Relocation Services Ll
Bought by
Caughern James A and Caughern Amanda J
Current Estimated Value
Home Financials for this Owner
Home Financials are based on the most recent Mortgage that was taken out on this home.
Original Mortgage
$158,065
Outstanding Balance
$109,120
Interest Rate
4.66%
Mortgage Type
FHA
Estimated Equity
$164,687
Purchase Details
Closed on
Apr 30, 2010
Sold by
Coman David P and Coman Shannon J
Bought by
Mckee Jesse M and Mckee Heather J
Home Financials for this Owner
Home Financials are based on the most recent Mortgage that was taken out on this home.
Original Mortgage
$170,000
Interest Rate
4.91%
Mortgage Type
New Conventional
Purchase Details
Closed on
Jan 29, 2005
Sold by
Dunkleberger Scott and Dunkleberger Susan
Bought by
Coman Ii David P and Coman Shannon J
Purchase Details
Closed on
Oct 16, 2002
Sold by
Holt William C
Purchase Details
Closed on
Mar 7, 2000
Sold by
Herrington Dean A
Create a Home Valuation Report for This Property
The Home Valuation Report is an in-depth analysis detailing your home's value as well as a comparison with similar homes in the area
Home Values in the Area
Average Home Value in this Area
Purchase History
| Date | Buyer | Sale Price | Title Company |
|---|---|---|---|
| Caughern James A | $170,000 | None Available | |
| Mckee Jesse M | $180,000 | -- | |
| Coman Ii David P | $12,000 | None Available | |
| -- | $12,000 | -- | |
| -- | $5,000 | -- |
Source: Public Records
Mortgage History
| Date | Status | Borrower | Loan Amount |
|---|---|---|---|
| Open | Caughern James A | $158,065 | |
| Closed | Caughern James A | $158,065 | |
| Previous Owner | Mckee Jesse M | $170,000 |
Source: Public Records
Tax History Compared to Growth
Tax History
| Year | Tax Paid | Tax Assessment Tax Assessment Total Assessment is a certain percentage of the fair market value that is determined by local assessors to be the total taxable value of land and additions on the property. | Land | Improvement |
|---|---|---|---|---|
| 2024 | $2,655 | $23,107 | $1,920 | $21,187 |
| 2023 | $2,655 | $22,434 | $1,920 | $20,514 |
| 2022 | $2,568 | $22,434 | $1,920 | $20,514 |
| 2021 | $2,517 | $22,434 | $1,920 | $20,514 |
| 2020 | $2,574 | $22,434 | $1,920 | $20,514 |
| 2019 | $2,580 | $22,477 | $1,800 | $20,677 |
| 2018 | $2,567 | $22,477 | $1,800 | $20,677 |
| 2017 | $2,627 | $22,477 | $1,800 | $20,677 |
| 2016 | $2,449 | $22,333 | $1,735 | $20,598 |
| 2015 | $2,411 | $21,683 | $1,440 | $20,243 |
| 2014 | $2,403 | $21,683 | $1,440 | $20,243 |
Source: Public Records
Map
Nearby Homes
- 6628 Castle Ct
- 317 Autumn Ct
- 6627 Castle Ct
- 710 Castle Rd
- 6507 Autumn Cir
- 0 Bison Rd Unit 2518039
- 6612 Penny Ln
- 275 Turkey Creek Rd
- 325 Turkey Creek Rd
- 810 Crown Dr
- 925 SE Paddock Ct
- 6220 Sawgrass Dr
- 200 SE Quail Ridge Loop
- 5610 Baylor Dr
- 5912 Woodland Rd
- 5608 Harvard Dr
- 5822 Brandon Ct
- 5916 Coldspring Ln
- 5822 Coldspring Ln
- 5908 Coldspring Ln
- 453 Chisholm Cir
- 405 Chisholm Cir
- 448 Chisholm Cir
- 442 Chisholm Cir
- 454 Chisholm Cir
- 432 Chisholm Cir
- 438 Chisholm Cir
- 401 Chisholm Cir
- 426 Chisholm Cir
- 501 Chisholm Cir
- 400 Chisholm Cir
- 500 Chisholm Cir
- 418 Chisholm Cir
- 412 Chisholm Cir
- 404 Chisholm Cir
- 505 Chisholm Cir
- 502 Dorsett Ct
- 504 Dorsett Ct
- 504 Chisholm Cir
- 406 Valley View Ct