Estimated Value: $192,000 - $231,000
3
Beds
2
Baths
1,529
Sq Ft
$139/Sq Ft
Est. Value
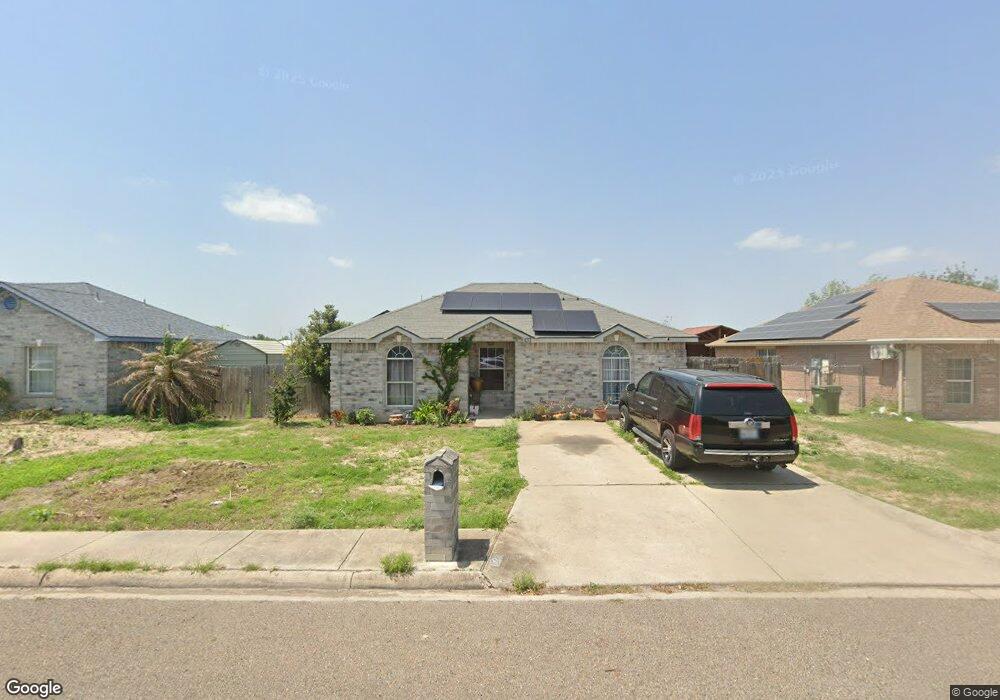
About This Home
This home is located at 433 Dulce Dr, Alamo, TX 78516 and is currently estimated at $213,238, approximately $139 per square foot. 433 Dulce Dr is a home located in Hidalgo County with nearby schools including Capt. D. Salinas Elementary School, A.P. Solis Middle School, and Donna High School.
Ownership History
Date
Name
Owned For
Owner Type
Purchase Details
Closed on
Nov 27, 2006
Sold by
Wells Fargo Bank Na
Bought by
Zabala Enedino T
Current Estimated Value
Purchase Details
Closed on
Aug 1, 2006
Sold by
Jimmenez Margarita Linda and Jimmenez Reyes
Bought by
Wells Farfo Bank Na
Purchase Details
Closed on
May 31, 2005
Sold by
Landmark Valley Homes Inc
Bought by
Reyes Linda Margartia Jimenez
Home Financials for this Owner
Home Financials are based on the most recent Mortgage that was taken out on this home.
Original Mortgage
$66,254
Interest Rate
5.78%
Mortgage Type
Purchase Money Mortgage
Create a Home Valuation Report for This Property
The Home Valuation Report is an in-depth analysis detailing your home's value as well as a comparison with similar homes in the area
Home Values in the Area
Average Home Value in this Area
Purchase History
| Date | Buyer | Sale Price | Title Company |
|---|---|---|---|
| Zabala Enedino T | -- | Charge Sierra Title | |
| Wells Farfo Bank Na | $76,060 | None Available | |
| Reyes Linda Margartia Jimenez | -- | None Available |
Source: Public Records
Mortgage History
| Date | Status | Borrower | Loan Amount |
|---|---|---|---|
| Previous Owner | Reyes Linda Margartia Jimenez | $66,254 |
Source: Public Records
Tax History Compared to Growth
Tax History
| Year | Tax Paid | Tax Assessment Tax Assessment Total Assessment is a certain percentage of the fair market value that is determined by local assessors to be the total taxable value of land and additions on the property. | Land | Improvement |
|---|---|---|---|---|
| 2025 | $1,461 | $158,468 | -- | -- |
| 2024 | $1,461 | $144,062 | -- | -- |
| 2023 | $3,333 | $130,965 | $0 | $0 |
| 2022 | $2,033 | $78,044 | $0 | $0 |
| 2021 | $1,861 | $70,949 | $28,860 | $61,637 |
| 2020 | $1,749 | $64,499 | $28,470 | $56,768 |
| 2019 | $1,608 | $58,635 | $19,500 | $39,135 |
| 2018 | $1,623 | $59,593 | $19,500 | $40,093 |
| 2017 | $1,670 | $60,552 | $19,500 | $41,052 |
| 2016 | $1,524 | $55,249 | $17,940 | $37,309 |
| 2015 | $1,507 | $55,710 | $17,940 | $37,770 |
Source: Public Records
Map
Nearby Homes