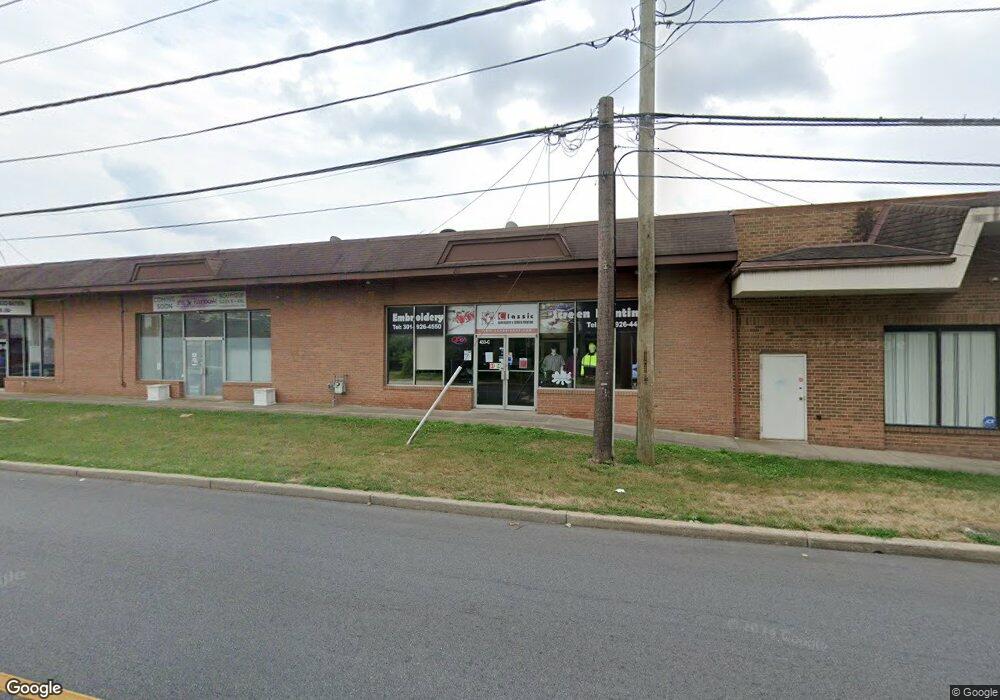
433 E Diamond Ave Gaithersburg, MD 20877
Studio
--
Bath
26,656
Sq Ft
1.51
Acres
About This Home
This home is located at 433 E Diamond Ave, Gaithersburg, MD 20877. 433 E Diamond Ave is a home located in Montgomery County with nearby schools including Forest Oak Middle School, Gaithersburg High School, and St Martin Of Tours School.
Ownership History
Date
Name
Owned For
Owner Type
Purchase Details
Closed on
Dec 23, 2025
Sold by
Rg Industrial Center Llc
Bought by
Sl 433 E Diamond Llc
Purchase Details
Closed on
May 23, 2017
Sold by
Offenbacher Karl and Offenbacher Alpana
Bought by
Rg Industrial Center Llc
Home Financials for this Owner
Home Financials are based on the most recent Mortgage that was taken out on this home.
Original Mortgage
$8,700,000
Interest Rate
4.02%
Mortgage Type
Commercial
Purchase Details
Closed on
Mar 22, 2001
Sold by
Offenbacher Karl F
Bought by
Offenbacher Karl Et Al Tr
Create a Home Valuation Report for This Property
The Home Valuation Report is an in-depth analysis detailing your home's value as well as a comparison with similar homes in the area
Home Values in the Area
Average Home Value in this Area
Purchase History
| Date | Buyer | Sale Price | Title Company |
|---|---|---|---|
| Sl 433 E Diamond Llc | $5,230,227 | None Listed On Document | |
| Rg Industrial Center Llc | $11,750,000 | Banner Title Co Inc | |
| Offenbacher Karl Et Al Tr | -- | -- |
Source: Public Records
Mortgage History
| Date | Status | Borrower | Loan Amount |
|---|---|---|---|
| Previous Owner | Rg Industrial Center Llc | $8,700,000 |
Source: Public Records
Tax History Compared to Growth
Tax History
| Year | Tax Paid | Tax Assessment Tax Assessment Total Assessment is a certain percentage of the fair market value that is determined by local assessors to be the total taxable value of land and additions on the property. | Land | Improvement |
|---|---|---|---|---|
| 2025 | $46,300 | $2,993,133 | -- | -- |
| 2024 | $46,300 | $2,896,567 | $0 | $0 |
| 2023 | $44,853 | $2,800,000 | $1,079,400 | $1,720,600 |
| 2022 | $43,638 | $2,760,667 | $0 | $0 |
| 2021 | $42,264 | $2,721,333 | $0 | $0 |
| 2020 | $42,264 | $2,682,000 | $1,079,400 | $1,602,600 |
| 2019 | $41,297 | $2,604,900 | $0 | $0 |
| 2018 | $42,315 | $2,698,300 | $0 | $0 |
| 2017 | $39,281 | $2,450,700 | $0 | $0 |
| 2016 | -- | $2,404,867 | $0 | $0 |
| 2015 | $32,812 | $2,359,033 | $0 | $0 |
| 2014 | $32,812 | $2,313,200 | $0 | $0 |
Source: Public Records
Map
Nearby Homes
- 436 - 438 Diamond Ave
- 108 Bowsprit Ct
- 14 Standard Ct
- 14 Benji Ct
- 42 Brian Ct
- 10 Brian Ct
- 34 Federal Ct
- 46 State Ct
- 48 Anna Ct
- 454 Girard St Unit 103
- 402 Girard St Unit T3
- 128 Washington Grove Ln
- 76 Nina Ct
- 420 Girard St Unit 103
- 422 Girard St Unit 303
- 426 Girard St
- 217 Central Ave
- 101 Brookes Ave
- 111 Grove Ave
- 442 Whetstone Glen St
- 433 E Diamond Ave Unit A
- 433 E Diamond Ave Unit B
- 761 Cobbler Place
- 431 E Diamond Ave
- 435 E Diamond Ave Unit MO
- 440 E Diamond Ave
- 442 E Diamond Ave
- 501 E Diamond Ave
- 438 E Diamond Ave
- 434 E Diamond Ave
- 429 E Diamond Ave
- 429 E Diamond Ave Unit A-2
- 429 E Diamond Ave Unit H
- 430 E Diamond Ave
- 436 E Diamond Ave
- 428 E Diamond Ave
- 425 E Diamond Ave
- 427 E Diamond Ave
- 426 E Diamond Ave
- 120 Woodland Rd