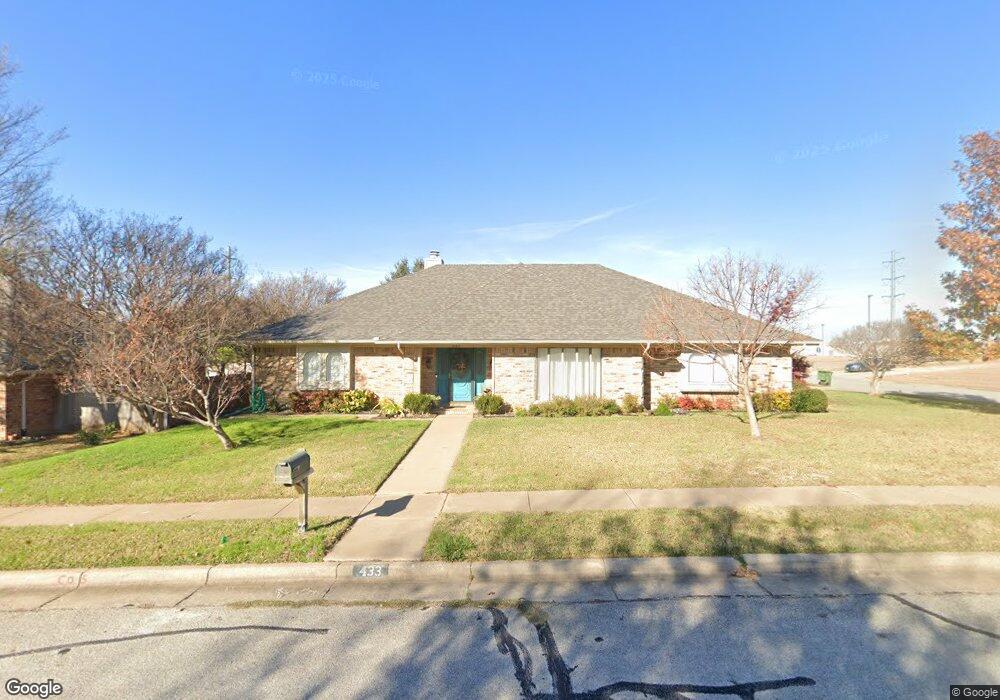
433 Elisha Dr Bedford, TX 76021
Estimated Value: $397,000 - $427,000
3
Beds
2
Baths
2,189
Sq Ft
$186/Sq Ft
Est. Value
About This Home
This home is located at 433 Elisha Dr, Bedford, TX 76021 and is currently estimated at $407,642, approximately $186 per square foot. 433 Elisha Dr is a home located in Tarrant County with nearby schools including Shady Oaks Elementary School, Bedford Junior High School, and L.D. Bell High School.
Ownership History
Date
Name
Owned For
Owner Type
Purchase Details
Closed on
Jun 24, 2002
Sold by
French James E and French Mary
Bought by
Unrue Charles Bruce and Unrue Anne L
Current Estimated Value
Home Financials for this Owner
Home Financials are based on the most recent Mortgage that was taken out on this home.
Original Mortgage
$114,100
Outstanding Balance
$48,517
Interest Rate
6.89%
Estimated Equity
$359,125
Purchase Details
Closed on
Sep 28, 2000
Sold by
Jones Connie Alice
Bought by
French James L and French Mary F
Purchase Details
Closed on
Nov 5, 1999
Sold by
Powell Mary Motea
Bought by
French James L and French Mary F
Home Financials for this Owner
Home Financials are based on the most recent Mortgage that was taken out on this home.
Original Mortgage
$100,000
Interest Rate
8.29%
Mortgage Type
Seller Take Back
Purchase Details
Closed on
Apr 14, 1994
Sold by
Powell O B and Powell Mary Motea
Bought by
Powell O B and Powell Mary Motea
Create a Home Valuation Report for This Property
The Home Valuation Report is an in-depth analysis detailing your home's value as well as a comparison with similar homes in the area
Home Values in the Area
Average Home Value in this Area
Purchase History
| Date | Buyer | Sale Price | Title Company |
|---|---|---|---|
| Unrue Charles Bruce | -- | Commonwealth Land Title | |
| French James L | -- | -- | |
| French James L | -- | -- | |
| Powell O B | -- | -- |
Source: Public Records
Mortgage History
| Date | Status | Borrower | Loan Amount |
|---|---|---|---|
| Open | Unrue Charles Bruce | $114,100 | |
| Previous Owner | French James L | $100,000 |
Source: Public Records
Tax History Compared to Growth
Tax History
| Year | Tax Paid | Tax Assessment Tax Assessment Total Assessment is a certain percentage of the fair market value that is determined by local assessors to be the total taxable value of land and additions on the property. | Land | Improvement |
|---|---|---|---|---|
| 2025 | $4,427 | $378,518 | $75,000 | $303,518 |
| 2024 | $4,427 | $378,518 | $75,000 | $303,518 |
| 2023 | $6,615 | $347,562 | $55,000 | $292,562 |
| 2022 | $6,848 | $333,905 | $55,000 | $278,905 |
| 2021 | $6,714 | $285,027 | $55,000 | $230,027 |
| 2020 | $6,552 | $275,585 | $55,000 | $220,585 |
| 2019 | $6,274 | $287,530 | $55,000 | $232,530 |
| 2018 | $5,322 | $234,788 | $55,000 | $179,788 |
| 2017 | $5,164 | $232,760 | $40,000 | $192,760 |
| 2016 | $4,694 | $199,319 | $40,000 | $159,319 |
| 2015 | $4,155 | $176,400 | $17,000 | $159,400 |
| 2014 | $4,155 | $176,400 | $17,000 | $159,400 |
Source: Public Records
Map
Nearby Homes
- 432 Sunnybrook Ct
- 121 Kay Ct
- 124 Jeannie Ct
- 1732 Jeannie Ln
- 1740 Brown Trail
- 817 Shady Lake Dr
- 2436 Brookgreen Ct
- 2420 Stonegate Dr N
- 100 Hillview Ct
- 801 Shady Creek Ln
- 320 Blue Quail Ct
- 3119 Spring Grove Dr
- 922 Shady Creek Ln
- 3213 Spring Valley Dr
- 2225 Shady Brook Dr
- 1013 Springdale Rd
- 305 Warbler Dr
- 2501 Shady Grove Dr
- 440 W Louella Dr
- 2317 Shady Grove Dr
- 429 Elisha Dr
- 420 Miranda Terrace
- 416 Miranda Terrace
- 432 Elisha Dr
- 428 Elisha Dr
- 425 Elisha Dr
- 412 Miranda Terrace
- 424 Elisha Dr
- 197 Shady Lake Dr
- 421 Elisha Dr
- 408 Miranda Terrace
- 193 Shady Lake Dr
- 433 Miranda Terrace
- 420 Elisha Dr
- 429 Miranda Terrace
- 425 Miranda Terrace
- 189 Shady Lake Dr
- 204 Shady Lake Dr
- 417 Elisha Dr
- 416 Elisha Dr