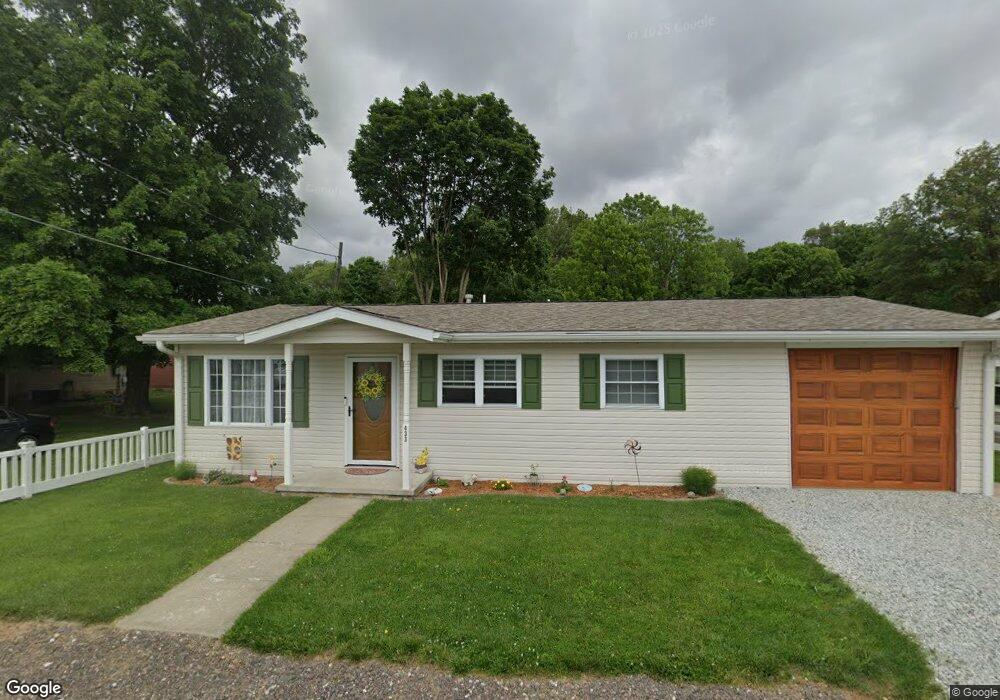
433 Fairview St Loogootee, IN 47553
Estimated Value: $142,361 - $178,000
2
Beds
1
Bath
1,080
Sq Ft
$145/Sq Ft
Est. Value
About This Home
This home is located at 433 Fairview St, Loogootee, IN 47553 and is currently estimated at $156,090, approximately $144 per square foot. 433 Fairview St is a home located in Martin County with nearby schools including Loogootee Elementary School, Loogootee Middle School, and Loogootee Junior/Senior High School.
Ownership History
Date
Name
Owned For
Owner Type
Purchase Details
Closed on
Oct 17, 2023
Sold by
Rinehart Thomas Allen
Bought by
Rinehart Thomas Allen and Cherry Catherine Anne
Current Estimated Value
Purchase Details
Closed on
May 31, 2023
Sold by
Rinehart Sara
Bought by
Rinehart Thomas Allen
Purchase Details
Closed on
Aug 7, 2020
Sold by
Gingerich Jessica M
Bought by
Rinehart Sara J and Rinehart Thomas A
Home Financials for this Owner
Home Financials are based on the most recent Mortgage that was taken out on this home.
Original Mortgage
$3,080
Interest Rate
3%
Mortgage Type
Unknown
Create a Home Valuation Report for This Property
The Home Valuation Report is an in-depth analysis detailing your home's value as well as a comparison with similar homes in the area
Home Values in the Area
Average Home Value in this Area
Purchase History
| Date | Buyer | Sale Price | Title Company |
|---|---|---|---|
| Rinehart Thomas Allen | -- | None Listed On Document | |
| Rinehart Thomas Allen | -- | None Listed On Document | |
| Rinehart Sara J | -- | None Available |
Source: Public Records
Mortgage History
| Date | Status | Borrower | Loan Amount |
|---|---|---|---|
| Previous Owner | Rinehart Sara J | $3,080 | |
| Previous Owner | Rinehart Sara J | $86,406 |
Source: Public Records
Tax History
| Year | Tax Paid | Tax Assessment Tax Assessment Total Assessment is a certain percentage of the fair market value that is determined by local assessors to be the total taxable value of land and additions on the property. | Land | Improvement |
|---|---|---|---|---|
| 2025 | $575 | $104,000 | $9,800 | $94,200 |
| 2024 | $575 | $100,500 | $9,500 | $91,000 |
| 2023 | $575 | $92,800 | $9,200 | $83,600 |
| 2022 | $406 | $87,500 | $8,800 | $78,700 |
| 2021 | $403 | $80,700 | $8,400 | $72,300 |
| 2020 | $310 | $72,100 | $8,200 | $63,900 |
| 2019 | $292 | $69,500 | $7,900 | $61,600 |
| 2018 | $289 | $68,400 | $7,800 | $60,600 |
| 2017 | $251 | $63,700 | $7,600 | $56,100 |
| 2016 | $235 | $62,400 | $7,400 | $55,000 |
| 2014 | $213 | $60,200 | $7,300 | $52,900 |
| 2013 | -- | $57,800 | $7,300 | $50,500 |
Source: Public Records
Map
Nearby Homes
- Lot 34 Country Court S D V
- Lot 27 Country Court S D V
- Lot 23 Country Court S D V
- Lot 26 Country Court S D V
- Lot 38 Country Court S D V
- Lot 15 Country Court S D V
- Lot 33 Country Court S D V
- Lot 32 Country Court S D V
- Lot 24 Country Court S D V
- Lot 14 Country Court S D V
- Lot 28 Country Court S D V
- Lot 16 Country Court S D V
- Lot 35 Country Court S D V
- Lot 40 Country Court S D V
- Lot 37 Country Court S D V
- Lot 17 Country Court S D V
- Lot 20 Country Court S D V
- Lot 19 Country Court S D V
- Lot 29 Country Court S D V
- Lot 21 Country Court S D V
- 429 Fairview St
- 434 Fairview St
- 437 Fairview St
- 430 Fairview St
- 425 Fairview St
- 13134 Us Highway 231
- 13134 Us Highway 231
- 426 Fairview St
- 438 Fairview St
- 820 N John F. Kennedy Ave
- 421 Fairview St
- 422 Fairview St
- 818 N John F. Kennedy Ave
- 420 Fairview St
- 415 Fairview St
- 414 Fairview St
- 816 N John F. Kennedy Ave
- 409 Fairview St
- 812 N John F. Kennedy Ave
- 810 N John F. Kennedy Ave
Your Personal Tour Guide
Ask me questions while you tour the home.