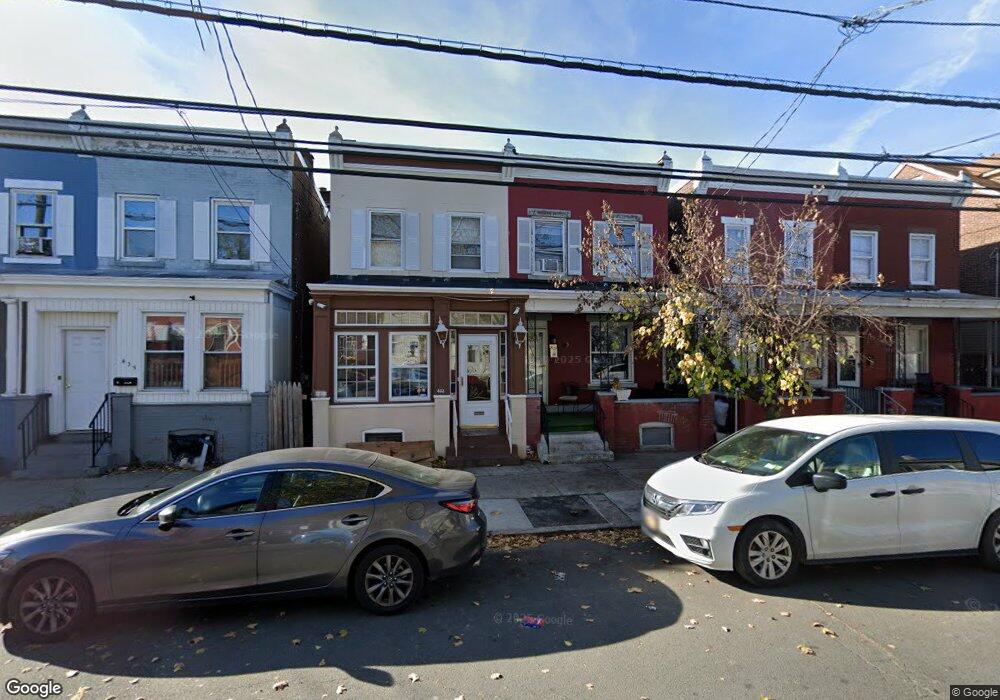
433 Genesee St Trenton, NJ 08611
Chambersburg NeighborhoodEstimated Value: $189,454 - $235,000
--
Bed
--
Bath
1,322
Sq Ft
$164/Sq Ft
Est. Value
About This Home
This home is located at 433 Genesee St, Trenton, NJ 08611 and is currently estimated at $217,364, approximately $164 per square foot. 433 Genesee St is a home located in Mercer County with nearby schools including Harrison Elementary School, Monument Elementary School, and Dr. Crosby Copeland Elementary School.
Ownership History
Date
Name
Owned For
Owner Type
Purchase Details
Closed on
Aug 25, 2006
Sold by
Hornyak John
Bought by
Lara Carlos
Current Estimated Value
Home Financials for this Owner
Home Financials are based on the most recent Mortgage that was taken out on this home.
Original Mortgage
$127,800
Outstanding Balance
$76,520
Interest Rate
6.71%
Estimated Equity
$140,844
Create a Home Valuation Report for This Property
The Home Valuation Report is an in-depth analysis detailing your home's value as well as a comparison with similar homes in the area
Home Values in the Area
Average Home Value in this Area
Purchase History
| Date | Buyer | Sale Price | Title Company |
|---|---|---|---|
| Lara Carlos | $140,000 | -- |
Source: Public Records
Mortgage History
| Date | Status | Borrower | Loan Amount |
|---|---|---|---|
| Open | Lara Carlos | $127,800 |
Source: Public Records
Tax History Compared to Growth
Tax History
| Year | Tax Paid | Tax Assessment Tax Assessment Total Assessment is a certain percentage of the fair market value that is determined by local assessors to be the total taxable value of land and additions on the property. | Land | Improvement |
|---|---|---|---|---|
| 2025 | $3,330 | $57,400 | $8,900 | $48,500 |
| 2024 | $3,195 | $57,400 | $8,900 | $48,500 |
| 2023 | $3,195 | $57,400 | $8,900 | $48,500 |
| 2022 | $3,133 | $57,400 | $8,900 | $48,500 |
| 2021 | $3,187 | $57,400 | $8,900 | $48,500 |
| 2020 | $3,177 | $57,400 | $8,900 | $48,500 |
| 2019 | $3,126 | $57,400 | $8,900 | $48,500 |
| 2018 | $2,992 | $57,400 | $8,900 | $48,500 |
| 2017 | $2,844 | $57,400 | $8,900 | $48,500 |
| 2016 | $3,785 | $65,800 | $17,600 | $48,200 |
| 2015 | $3,772 | $65,800 | $17,600 | $48,200 |
| 2014 | $3,755 | $65,800 | $17,600 | $48,200 |
Source: Public Records
Map
Nearby Homes