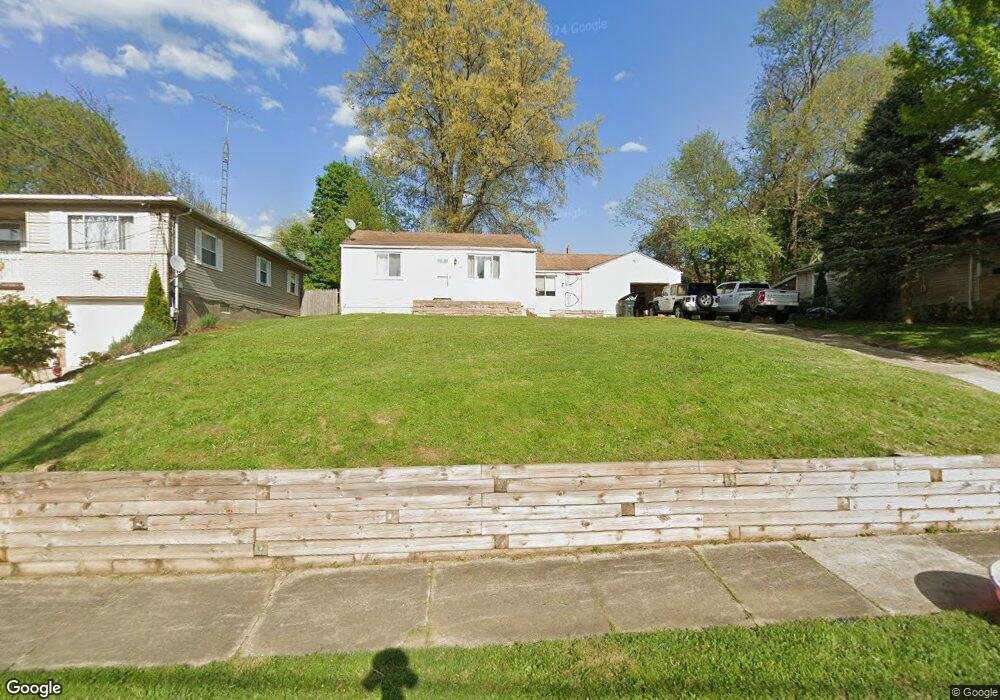
433 Gibbs Rd Akron, OH 44312
Ellet NeighborhoodEstimated Value: $97,000 - $168,998
2
Beds
1
Bath
1,020
Sq Ft
$132/Sq Ft
Est. Value
About This Home
This home is located at 433 Gibbs Rd, Akron, OH 44312 and is currently estimated at $134,250, approximately $131 per square foot. 433 Gibbs Rd is a home located in Summit County with nearby schools including Ellet High School, Summit Academy Akron Elementary School, and Akron Preparatory school.
Ownership History
Date
Name
Owned For
Owner Type
Purchase Details
Closed on
Jul 25, 2025
Sold by
Bowers Kyle Nicolas
Bought by
Oilgate Realty Llc
Current Estimated Value
Home Financials for this Owner
Home Financials are based on the most recent Mortgage that was taken out on this home.
Original Mortgage
$115,500
Outstanding Balance
$96,724
Interest Rate
5.97%
Mortgage Type
Construction
Estimated Equity
$37,526
Purchase Details
Closed on
Sep 6, 2022
Sold by
Bowers Sean
Bought by
Bowers Kyle Nicolas
Home Financials for this Owner
Home Financials are based on the most recent Mortgage that was taken out on this home.
Original Mortgage
$75,193
Interest Rate
5.75%
Mortgage Type
FHA
Purchase Details
Closed on
May 22, 2008
Sold by
The Bank Of New York Trust Co Na
Bought by
Bowers Sean
Purchase Details
Closed on
Sep 17, 2007
Sold by
Hendricks Steven A
Bought by
The Bank Of New York Trust Co Na and Jp Morgan Chase Bank Na
Purchase Details
Closed on
Apr 6, 2005
Sold by
Chlebina John and Chelbina Mary K
Bought by
Hendricks Steven A and Hendricks Neana L
Home Financials for this Owner
Home Financials are based on the most recent Mortgage that was taken out on this home.
Original Mortgage
$87,550
Interest Rate
8.87%
Mortgage Type
Purchase Money Mortgage
Create a Home Valuation Report for This Property
The Home Valuation Report is an in-depth analysis detailing your home's value as well as a comparison with similar homes in the area
Home Values in the Area
Average Home Value in this Area
Purchase History
| Date | Buyer | Sale Price | Title Company |
|---|---|---|---|
| Oilgate Realty Llc | $90,000 | Stewart Title | |
| Bowers Kyle Nicolas | $100,000 | None Listed On Document | |
| Bowers Sean | $51,975 | Resource Title Agency Inc | |
| The Bank Of New York Trust Co Na | $60,000 | None Available | |
| Hendricks Steven A | $77,000 | -- |
Source: Public Records
Mortgage History
| Date | Status | Borrower | Loan Amount |
|---|---|---|---|
| Open | Oilgate Realty Llc | $115,500 | |
| Previous Owner | Bowers Kyle Nicolas | $75,193 | |
| Previous Owner | Hendricks Steven A | $87,550 |
Source: Public Records
Tax History Compared to Growth
Tax History
| Year | Tax Paid | Tax Assessment Tax Assessment Total Assessment is a certain percentage of the fair market value that is determined by local assessors to be the total taxable value of land and additions on the property. | Land | Improvement |
|---|---|---|---|---|
| 2025 | $2,350 | $40,138 | $13,797 | $26,341 |
| 2024 | $2,350 | $40,138 | $13,797 | $26,341 |
| 2023 | $2,350 | $40,138 | $13,797 | $26,341 |
| 2022 | $2,228 | $29,733 | $10,220 | $19,513 |
| 2021 | $2,119 | $29,733 | $10,220 | $19,513 |
| 2020 | $2,088 | $29,730 | $10,220 | $19,510 |
| 2019 | $1,940 | $24,960 | $8,740 | $16,220 |
| 2018 | $1,915 | $24,960 | $8,740 | $16,220 |
| 2017 | $1,820 | $24,960 | $8,740 | $16,220 |
| 2016 | $1,870 | $23,980 | $6,490 | $17,490 |
| 2015 | $1,820 | $23,980 | $6,490 | $17,490 |
| 2014 | $1,806 | $23,980 | $6,490 | $17,490 |
| 2013 | $1,431 | $19,030 | $6,490 | $12,540 |
Source: Public Records
Map
Nearby Homes
- 427 Fulmer Ave
- 406 Baldwin Rd
- 490 Stephens Rd
- 515 Hillman Rd
- 560 Massillon Rd
- 1835 Penthley Ave
- 586 Hillman Rd
- 594 Hillman Rd Unit 596
- 625 Fulmer Ave
- 600 Hillman Rd Unit 602
- 597 Hillman Rd
- 452 Herbert Rd
- 1629 Wildon Ave
- 0 Essex St
- 1549 Merrill Ave
- 198 Hilbish Ave
- 159 Dellenberger Ave
- 181 Hilbish Ave
- 195 Prairie Dr
- 226 Homewood Ave