S
Landlord's Agent in 2015
Sheldon Terry
Invitation Homes
(678) 490-8175
Estimated Value: $318,876 - $341,000
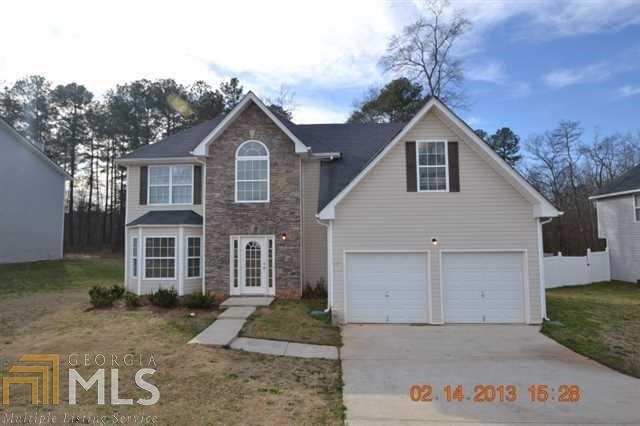
Great floor plan. Professionally managed with full warranty service and preventative maintenance program.
Last Agent to Rent the Property
Invitation Homes License #295912 Listed on: 09/09/2015

| Date | Buyer | Sale Price | Title Company |
|---|---|---|---|
| 2017 1 Ih Borrower Lp | -- | -- | |
| 2014 1 Ih Borrower Lp | -- | -- | |
| Thr Georgia Lp | $100,000 | -- | |
| Mccrae Perry D | $169,800 | -- |
| Date | Status | Borrower | Loan Amount |
|---|---|---|---|
| Previous Owner | Mccrae Perry D | $173,389 |
| Date | Event | Price | List to Sale | Price per Sq Ft | Prior Sale |
|---|---|---|---|---|---|
| 09/09/2015 09/09/15 | Rented | $1,165 | 0.0% | -- | |
| 09/09/2015 09/09/15 | For Rent | $1,165 | -2.5% | -- | |
| 06/14/2013 06/14/13 | Rented | $1,195 | 0.0% | -- | |
| 05/15/2013 05/15/13 | Under Contract | -- | -- | -- | |
| 02/15/2013 02/15/13 | For Rent | $1,195 | 0.0% | -- | |
| 11/09/2012 11/09/12 | Sold | $100,000 | 0.0% | $35 / Sq Ft | View Prior Sale |
| 10/10/2012 10/10/12 | Pending | -- | -- | -- | |
| 10/04/2012 10/04/12 | For Sale | $100,000 | -- | $35 / Sq Ft |
| Year | Tax Paid | Tax Assessment Tax Assessment Total Assessment is a certain percentage of the fair market value that is determined by local assessors to be the total taxable value of land and additions on the property. | Land | Improvement |
|---|---|---|---|---|
| 2025 | $5,261 | $135,240 | $14,000 | $121,240 |
| 2024 | $5,261 | $134,640 | $14,000 | $120,640 |
| 2023 | $4,635 | $128,040 | $14,000 | $114,040 |
| 2022 | $2,723 | $74,280 | $10,000 | $64,280 |
| 2021 | $2,728 | $74,280 | $10,000 | $64,280 |
| 2020 | $2,324 | $74,280 | $10,000 | $64,280 |
| 2019 | $2,279 | $60,880 | $8,000 | $52,880 |
| 2018 | $2,263 | $60,880 | $8,000 | $52,880 |
| 2016 | $2,023 | $54,440 | $8,000 | $46,440 |
| 2015 | $2,115 | $55,000 | $8,000 | $47,000 |
| 2014 | $1,867 | $48,360 | $8,000 | $40,360 |
S
Landlord's Agent in 2015
Sheldon Terry
Invitation Homes
(678) 490-8175
Tenant's Agent in 2015
Glenda Broker
Non-Mls Company
(800) 289-1214
N
Seller's Agent in 2013
Nicole Czaja
Keller Williams Realty Atl. Partners
J
Seller's Agent in 2012
Jeff Pruitt
Better Homes and Gardens Real Estate
(404) 843-2500
4 Total Sales
B
Buyer's Agent in 2012
Brian Taylor
Market South Properties Inc.
(404) 787-9243
15 Total Sales
Source: Georgia MLS
MLS Number: 7519958
APN: 128A-01-114-000
Disclaimer: Certain information contained herein is derived from information provided by parties other than Homes.com. All information provided is deemed reliable, but is not guaranteed to be accurate and should be independently verified.
![]() The data relating to real estate for sale on this web site comes in part from the Broker Reciprocity Program of Georgia MLS. Real estate listings held by brokerage firms other than Redfin are marked with the Broker Reciprocity logo and detailed information about them includes the name of the listing brokers. Information deemed reliable but not guaranteed. Copyright 2025 Georgia MLS. All rights reserved.
The data relating to real estate for sale on this web site comes in part from the Broker Reciprocity Program of Georgia MLS. Real estate listings held by brokerage firms other than Redfin are marked with the Broker Reciprocity logo and detailed information about them includes the name of the listing brokers. Information deemed reliable but not guaranteed. Copyright 2025 Georgia MLS. All rights reserved.