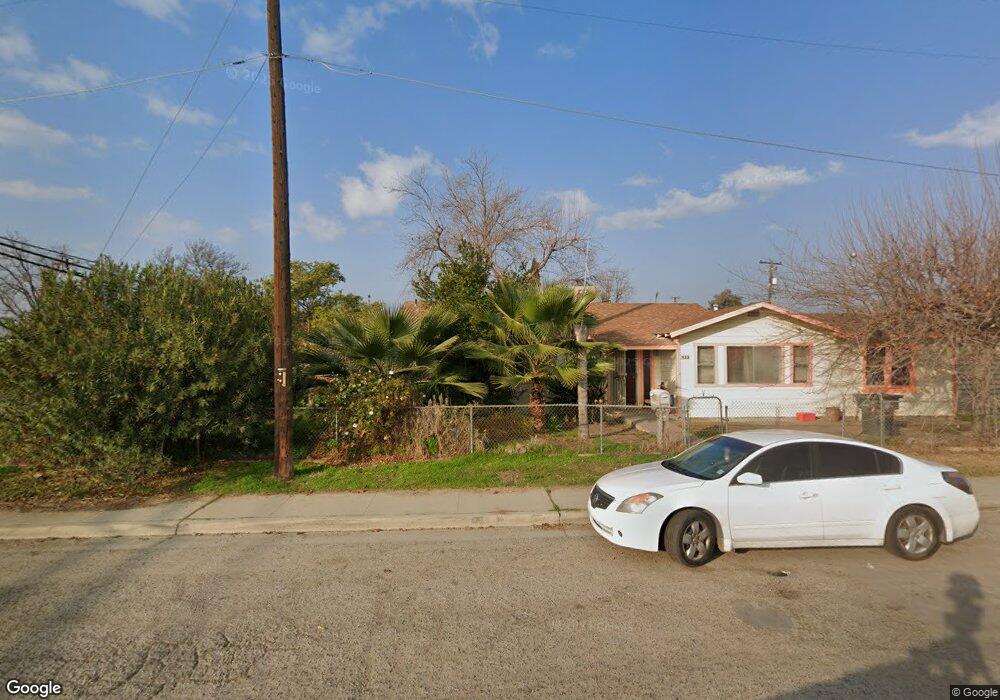
433 Grove St Arvin, CA 93203
Arvin AreaEstimated Value: $270,000 - $340,000
About This Home
This home is located at 433 Grove St, Arvin, CA 93203 and is currently estimated at $308,306, approximately $413 per square foot. 433 Grove St is a home located in Kern County with nearby schools including Bear Mountain Elementary School, Haven Drive Middle School, and Arvin High School.
Ownership History
We collect this data history from publicly available records. To have your information removed, we recommend requesting removal directly through your county’s website.
Purchase Details
Home Financials for this Owner
Home Financials are based on the most recent Mortgage that was taken out on this home.Purchase Details
Home Financials for this Owner
Home Financials are based on the most recent Mortgage that was taken out on this home.Home Values in the Area
Average Home Value in this Area
Purchase History
We collect this data history from publicly available records. To have your information removed, we recommend requesting removal directly through your county’s website.
| Date | Buyer | Sale Price | Title Company |
|---|---|---|---|
| -- | Accommodation | ||
| $34,000 | New Century Title Company |
Mortgage History
We collect this data history from publicly available records. To have your information removed, we recommend requesting removal directly through your county’s website.
| Date | Status | Borrower | Loan Amount |
|---|---|---|---|
| Closed | $68,000 |
Tax History
We collect this data history from publicly available records. To have your information removed, we recommend requesting removal directly through your county’s website.
| Year | Tax Paid | Tax Assessment Tax Assessment Total Assessment is a certain percentage of the fair market value that is determined by local assessors to be the total taxable value of land and additions on the property. | Land | Improvement |
|---|---|---|---|---|
| 2025 | $3,949 | $253,000 | $63,000 | $190,000 |
| 2024 | $3,738 | $250,000 | $63,000 | $187,000 |
| 2023 | $3,738 | $239,000 | $60,000 | $179,000 |
| 2022 | $3,253 | $198,000 | $50,000 | $148,000 |
| 2021 | $2,986 | $181,000 | $45,000 | $136,000 |
| 2020 | $2,676 | $156,000 | $39,000 | $117,000 |
| 2019 | $2,551 | $145,000 | $36,000 | $109,000 |
| 2018 | $2,408 | $136,000 | $34,000 | $102,000 |
| 2017 | $2,509 | $148,000 | $37,000 | $111,000 |
| 2016 | $2,276 | $136,000 | $34,000 | $102,000 |
| 2015 | $2,171 | $131,000 | $33,000 | $98,000 |
| 2014 | $1,981 | $117,000 | $29,000 | $88,000 |
Map
- 624 Tucker St
- 331 S Acala St
- 476 Franklin St
- 1113 La Madrid St
- 417 Wilson St
- 449 Campus Dr Unit A
- 381 B St
- 381 B St
- 0 E Bear Mountain Blvd
- 0 E Bear Mountain Blvd
- 0 E Bear Mountain Blvd
- 0 E Bear Mountain Blvd
- 801 Schipper St Unit 46
- 801 Schipper St Unit 65
- 801 Schipper St Unit 33
- 801 Schipper St Unit 60
- 301 N Derby St
- 140 Langford Ave
- 1836 Walnut Dr
- 0 Tejon Hwy
Ask me questions while you tour the home.