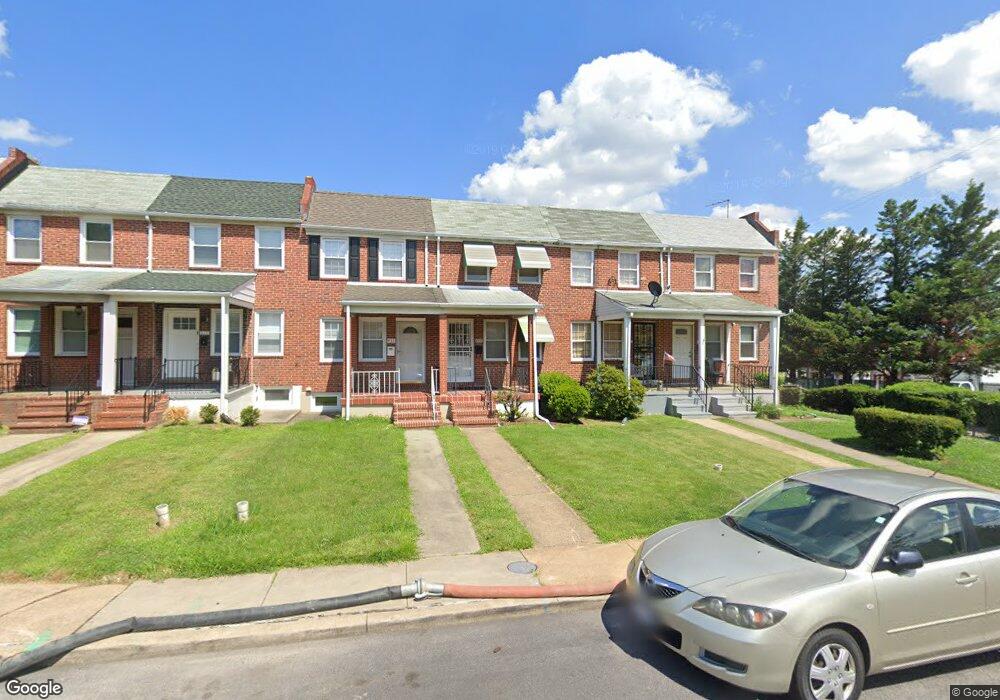
433 Joplin St Baltimore, MD 21224
Estimated Value: $126,000 - $152,759
--
Bed
2
Baths
840
Sq Ft
$166/Sq Ft
Est. Value
About This Home
This home is located at 433 Joplin St, Baltimore, MD 21224 and is currently estimated at $139,380, approximately $165 per square foot. 433 Joplin St is a home located in Baltimore City with nearby schools including Graceland Park-O'Donnell Heights Elementary/Middle School, Booker T. Washington Middle School, and Patterson High School.
Ownership History
Date
Name
Owned For
Owner Type
Purchase Details
Closed on
Apr 28, 2022
Sold by
Ensenat George N
Bought by
Ntb Llc
Current Estimated Value
Home Financials for this Owner
Home Financials are based on the most recent Mortgage that was taken out on this home.
Original Mortgage
$130,000
Interest Rate
4.67%
Mortgage Type
New Conventional
Create a Home Valuation Report for This Property
The Home Valuation Report is an in-depth analysis detailing your home's value as well as a comparison with similar homes in the area
Home Values in the Area
Average Home Value in this Area
Purchase History
| Date | Buyer | Sale Price | Title Company |
|---|---|---|---|
| Ntb Llc | $100,000 | Crown Title | |
| Ntb Llc | $100,000 | Crown Title |
Source: Public Records
Mortgage History
| Date | Status | Borrower | Loan Amount |
|---|---|---|---|
| Previous Owner | Ntb Llc | $130,000 |
Source: Public Records
Tax History Compared to Growth
Tax History
| Year | Tax Paid | Tax Assessment Tax Assessment Total Assessment is a certain percentage of the fair market value that is determined by local assessors to be the total taxable value of land and additions on the property. | Land | Improvement |
|---|---|---|---|---|
| 2025 | $2,521 | $116,100 | $25,000 | $91,100 |
| 2024 | $2,521 | $107,333 | $0 | $0 |
| 2023 | $2,315 | $98,567 | $0 | $0 |
| 2022 | $1,940 | $89,800 | $25,000 | $64,800 |
| 2021 | $2,119 | $89,800 | $25,000 | $64,800 |
| 2020 | $1,936 | $89,800 | $25,000 | $64,800 |
| 2019 | $1,990 | $92,900 | $25,000 | $67,900 |
| 2018 | $2,004 | $92,100 | $0 | $0 |
| 2017 | $2,007 | $91,300 | $0 | $0 |
| 2016 | $1,770 | $90,500 | $0 | $0 |
| 2015 | $1,770 | $90,500 | $0 | $0 |
| 2014 | $1,770 | $90,500 | $0 | $0 |
Source: Public Records
Map
Nearby Homes