Estimated Value: $390,139 - $503,000
3
Beds
2
Baths
2,136
Sq Ft
$202/Sq Ft
Est. Value
About This Home
This home is located at 433 Kent Cornwall Rd Unit 26, Kent, CT 06757 and is currently estimated at $431,285, approximately $201 per square foot. 433 Kent Cornwall Rd Unit 26 is a home located in Litchfield County with nearby schools including Kent Center School and Housatonic Valley Regional High School.
Ownership History
Date
Name
Owned For
Owner Type
Purchase Details
Closed on
Feb 11, 2023
Sold by
Bentley Lissa F and Bentley George A
Bought by
Dancing Nancies Llc
Current Estimated Value
Purchase Details
Closed on
Dec 12, 2022
Sold by
Bntley Nancy M Est
Bought by
Bentley Lisa F and Bentley George A
Purchase Details
Closed on
Jul 25, 2006
Sold by
Baroody Leila J and Baroody Lorraine F
Bought by
Bentley Nancy M
Create a Home Valuation Report for This Property
The Home Valuation Report is an in-depth analysis detailing your home's value as well as a comparison with similar homes in the area
Home Values in the Area
Average Home Value in this Area
Purchase History
| Date | Buyer | Sale Price | Title Company |
|---|---|---|---|
| Dancing Nancies Llc | -- | None Available | |
| Bentley Lisa F | -- | None Available | |
| Bentley Nancy M | $350,000 | -- |
Source: Public Records
Mortgage History
| Date | Status | Borrower | Loan Amount |
|---|---|---|---|
| Previous Owner | Bentley Nancy M | $50,000 |
Source: Public Records
Tax History
| Year | Tax Paid | Tax Assessment Tax Assessment Total Assessment is a certain percentage of the fair market value that is determined by local assessors to be the total taxable value of land and additions on the property. | Land | Improvement |
|---|---|---|---|---|
| 2025 | $3,394 | $201,200 | $0 | $201,200 |
| 2024 | $3,137 | $201,200 | $0 | $201,200 |
| 2023 | $3,150 | $167,900 | $0 | $167,900 |
| 2022 | $3,118 | $167,900 | $0 | $167,900 |
| 2021 | $3,118 | $167,900 | $0 | $167,900 |
| 2020 | $3,125 | $167,900 | $0 | $167,900 |
| 2019 | $3,125 | $167,900 | $0 | $167,900 |
| 2018 | $2,968 | $159,500 | $0 | $159,500 |
| 2017 | $2,968 | $159,500 | $0 | $159,500 |
| 2016 | $2,924 | $159,500 | $0 | $159,500 |
| 2015 | $2,849 | $159,500 | $0 | $159,500 |
| 2014 | $2,716 | $159,500 | $0 | $159,500 |
Source: Public Records
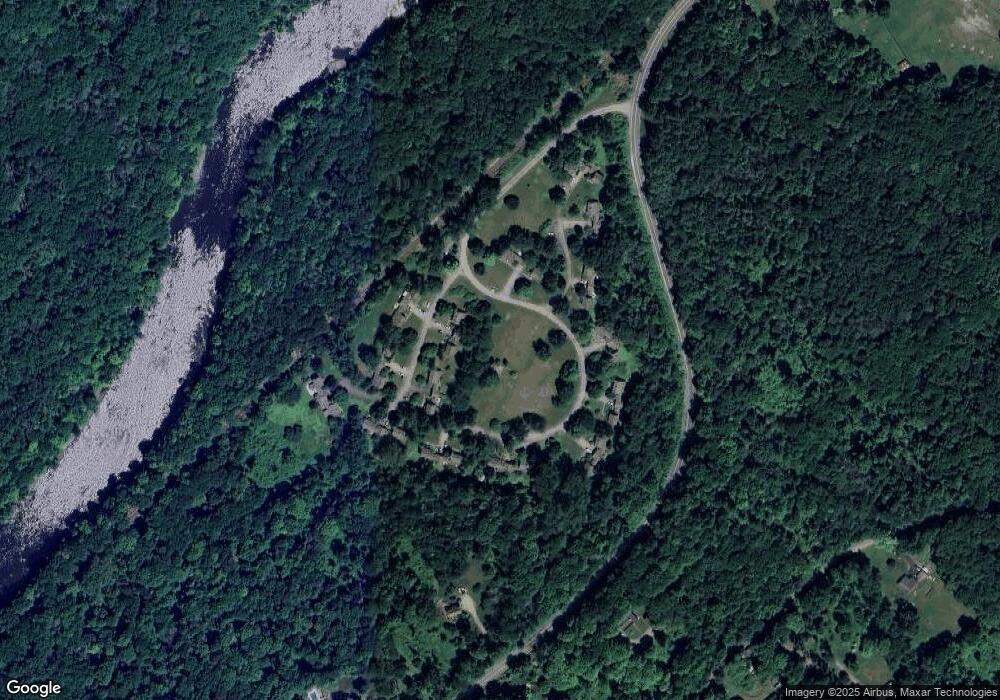
Map
Nearby Homes
- 11 Old Paddock Ln
- 0 Stonewall Unit 39
- 00 Kent Cornwall Rd
- 23 Mauwee Brook Rd
- 0 Mount Mauwee Rd
- 0 Gorham Rd Unit 24138133
- 1 W Woods Rd
- 308 Skiff Mountain Rd
- 0 W Woods Rd Unit 2
- 70 Kent Rd S
- 143 Whitcomb Hill Rd
- 221 Fuller Mountain Rd
- 00 Upper Kent Hollow Rd
- 11 Day Rd
- 34 Kent Rd
- 80 N Main St Unit 2A1
- 3 W Mountain Rd
- 0 Lake Rd
- 33 Nodine Pasture Rd
- 102 Melius Rd
- 433 Kent Cornwall Rd Unit 29
- 433 Kent Cornwall Rd Unit 1
- 433 Kent Cornwall Rd Unit 5
- 433 Kent Cornwall Rd Unit 10
- 433 Kent Cornwall Rd Unit 18
- 433 Kent Cornwall Rd Unit 2
- 433 Kent Cornwall Rd Unit 8
- 433 Kent Cornwall Rd Unit 6
- 433 Kent Cornwall Rd Unit 24
- 433 Kent Cornwall Rd Unit 22
- 433 Kent Cornwall Rd Unit 9
- 433 Kent Cornwall Rd Unit 15
- 433 Kent Cornwall Rd Unit 11
- 433 Kent Cornwall Rd Unit 7
- 433 Kent Cornwall Rd Unit 16
- 433 Kent Cornwall Rd Unit 3
- 433 Kent Cornwall Rd Unit 23
- 433 Kent Cornwall Rd Unit 4
- 433 Kent Cornwall Rd Unit 31
- 433 Kent Cornwall Rd Unit 30
Your Personal Tour Guide
Ask me questions while you tour the home.