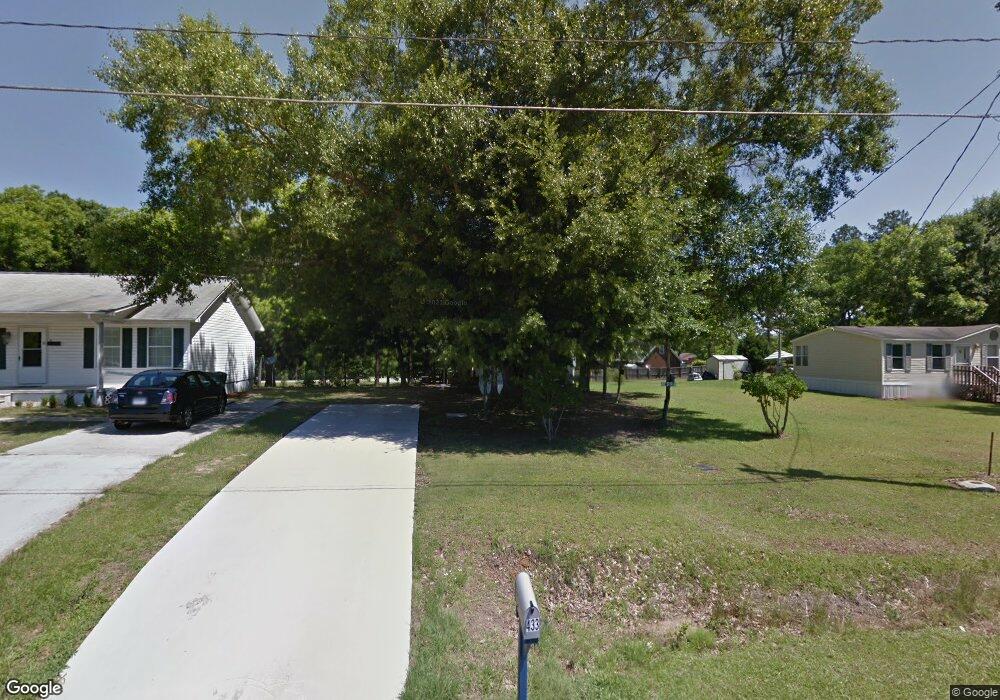
433 Main St Claxton, GA 30417
Estimated Value: $95,986 - $184,000
3
Beds
1
Bath
688
Sq Ft
$209/Sq Ft
Est. Value
About This Home
This home is located at 433 Main St, Claxton, GA 30417 and is currently estimated at $143,997, approximately $209 per square foot. 433 Main St is a home with nearby schools including Claxton Elementary School, Claxton Middle School, and Claxton High School.
Ownership History
Date
Name
Owned For
Owner Type
Purchase Details
Closed on
May 25, 2023
Sold by
Downside Investment Group Llc
Bought by
Sands J G
Current Estimated Value
Purchase Details
Closed on
Jun 24, 2020
Sold by
Dukes Marcus D
Bought by
Downside Investment Grp Llc
Home Financials for this Owner
Home Financials are based on the most recent Mortgage that was taken out on this home.
Original Mortgage
$121,600
Interest Rate
3.1%
Mortgage Type
Commercial
Purchase Details
Closed on
Sep 21, 2012
Sold by
Dukes Marcus D
Bought by
Dukes Marcus D
Purchase Details
Closed on
Mar 22, 2005
Sold by
Dukes Steven M
Bought by
Dukes Marcus D and Marcus D Dukes Trust
Purchase Details
Closed on
Sep 1, 2004
Sold by
Sands Carson
Bought by
Dukes Marcus D and Dukes Steven M
Purchase Details
Closed on
Jan 1, 1967
Sold by
Fuller Abbie Elizabeth Sands
Bought by
Sands Carson
Create a Home Valuation Report for This Property
The Home Valuation Report is an in-depth analysis detailing your home's value as well as a comparison with similar homes in the area
Purchase History
| Date | Buyer | Sale Price | Title Company |
|---|---|---|---|
| Sands J G | $165,000 | -- | |
| Downside Investment Grp Llc | $152,000 | -- | |
| Dukes Marcus D | -- | -- | |
| Dukes Marcus D | -- | -- | |
| Dukes Marcus D | $3,000 | -- | |
| Sands Carson | -- | -- |
Source: Public Records
Mortgage History
| Date | Status | Borrower | Loan Amount |
|---|---|---|---|
| Previous Owner | Downside Investment Grp Llc | $121,600 |
Source: Public Records
Tax History
| Year | Tax Paid | Tax Assessment Tax Assessment Total Assessment is a certain percentage of the fair market value that is determined by local assessors to be the total taxable value of land and additions on the property. | Land | Improvement |
|---|---|---|---|---|
| 2025 | $730 | $24,520 | $3,080 | $21,440 |
| 2024 | $605 | $18,380 | $1,817 | $16,563 |
| 2023 | $605 | $15,840 | $2,080 | $13,760 |
| 2022 | $446 | $15,840 | $2,080 | $13,760 |
| 2021 | $613 | $15,840 | $2,080 | $13,760 |
| 2020 | $613 | $15,760 | $2,080 | $13,680 |
| 2019 | $571 | $15,760 | $2,080 | $13,680 |
| 2018 | $568 | $15,600 | $2,080 | $13,520 |
| 2017 | $559 | $15,760 | $2,080 | $13,680 |
| 2016 | $551 | $15,480 | $1,560 | $13,920 |
| 2015 | -- | $15,800 | $1,600 | $14,200 |
| 2014 | -- | $15,800 | $1,600 | $14,200 |
| 2013 | -- | $15,960 | $1,600 | $14,360 |
Source: Public Records
Map
Nearby Homes
- 2947 Ivey Ave
- 0 Gus Tippins Rd Unit 25437413
- 0 Jacob Wilkinson Cir Unit 10662097
- 0 Sunbury Rd Unit Tract 4
- 0 Sunbury Rd Unit Tract 6
- 8893 Sunbury Rd
- 0 Bay Branch Rd
- 541 Live Oak Lane Rd
- 406 Mary Lee St
- 0 Live Oak Lane Rd Unit 10692430
- 0 Live Oak Lane Rd Unit 10692471
- 12 S Duval St
- 0 Peters St
- 320 N Duval St
- 307 Mclean St
- 3 Honeysuckle Dr
- 3 S Spring St
- 6 N Spring St
- 3 Wysteria Ln
- 9 Honeysuckle Dr
- 427 Main St Unit AB&433
- 427 Main St Unit B
- 427 Main St
- 435 Main St
- 419 Main St
- 15800 Be Smith Rd
- 411 Main St
- 502 W Railroad St
- 510 Railroad St
- 301 Melissa Ave
- 15852 Be Smith Rd
- 3056 Ivey Ave
- B E Smith Rd
- 309 Melissa Ave
- 405 Main St
- 15751 Be Smith Rd
- 15751 Be Smith Rd
- 509 Main St
- 314 Railroad St
- 3036 Ivey Ave
Your Personal Tour Guide
Ask me questions while you tour the home.