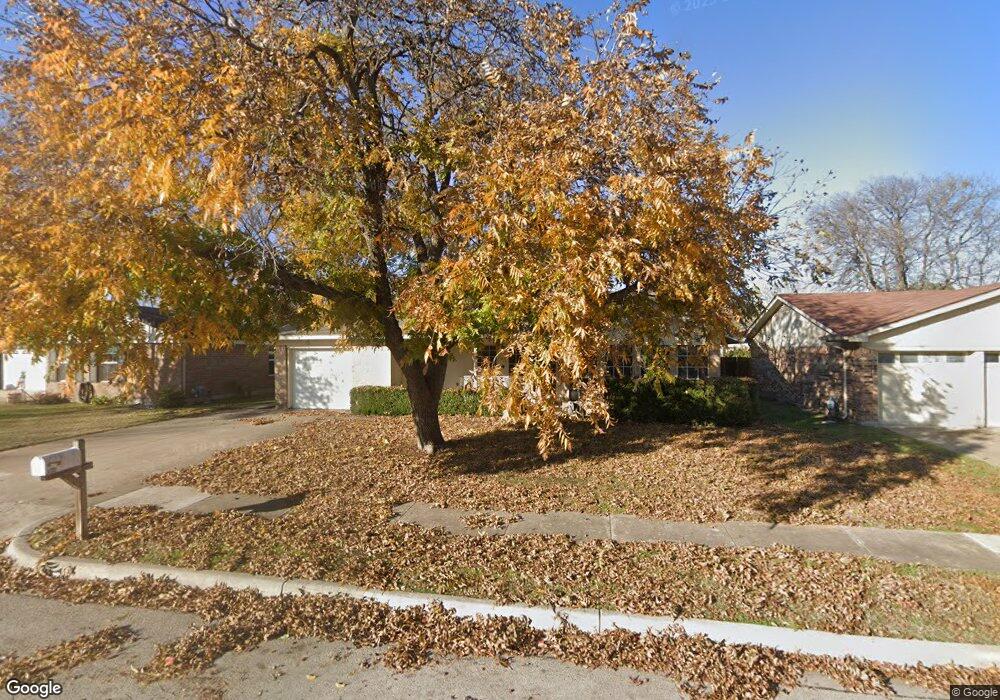
433 Marsha St Keller, TX 76248
Bear Creek Park NeighborhoodEstimated Value: $288,710 - $335,000
2
Beds
1
Bath
1,286
Sq Ft
$239/Sq Ft
Est. Value
About This Home
This home is located at 433 Marsha St, Keller, TX 76248 and is currently estimated at $307,178, approximately $238 per square foot. 433 Marsha St is a home located in Tarrant County with nearby schools including Keller-Harvel Elementary School, Keller Middle School, and Bear Creek Intermediate School.
Ownership History
Date
Name
Owned For
Owner Type
Purchase Details
Closed on
May 21, 2025
Sold by
Beecham Timothy Dean and Layman Kelly Lynn
Bought by
Gabrielson John L
Current Estimated Value
Purchase Details
Closed on
Aug 31, 2006
Sold by
Doughty Jerry Don and Doughty Donna Kay
Bought by
Phillips Linda J
Home Financials for this Owner
Home Financials are based on the most recent Mortgage that was taken out on this home.
Original Mortgage
$85,500
Interest Rate
6.79%
Mortgage Type
Purchase Money Mortgage
Create a Home Valuation Report for This Property
The Home Valuation Report is an in-depth analysis detailing your home's value as well as a comparison with similar homes in the area
Home Values in the Area
Average Home Value in this Area
Purchase History
| Date | Buyer | Sale Price | Title Company |
|---|---|---|---|
| Gabrielson John L | -- | National Title Group | |
| Phillips Linda J | -- | None Available |
Source: Public Records
Mortgage History
| Date | Status | Borrower | Loan Amount |
|---|---|---|---|
| Previous Owner | Phillips Linda J | $85,500 |
Source: Public Records
Tax History
| Year | Tax Paid | Tax Assessment Tax Assessment Total Assessment is a certain percentage of the fair market value that is determined by local assessors to be the total taxable value of land and additions on the property. | Land | Improvement |
|---|---|---|---|---|
| 2025 | $642 | $245,957 | -- | -- |
| 2024 | $635 | $262,463 | $60,000 | $202,463 |
| 2023 | $658 | $266,354 | $40,000 | $226,354 |
| 2022 | $4,076 | $212,404 | $40,000 | $172,404 |
| 2021 | $3,995 | $168,928 | $40,000 | $128,928 |
| 2020 | $3,660 | $152,720 | $40,000 | $112,720 |
| 2019 | $3,674 | $171,983 | $40,000 | $131,983 |
| 2018 | $1,285 | $132,665 | $20,000 | $112,665 |
| 2017 | $3,258 | $133,611 | $20,000 | $113,611 |
| 2016 | $2,962 | $135,295 | $20,000 | $115,295 |
| 2015 | $1,364 | $104,500 | $20,000 | $84,500 |
| 2014 | $1,364 | $104,500 | $20,000 | $84,500 |
Source: Public Records
Map
Nearby Homes
- 409 Bart St
- 422 Pearl St
- 406 Linda St
- 704 Fostery King Place
- 733 Avignon Trail Unit 83
- 408 Settlers Ridge Dr
- 204 Roy Ln
- 614 Cross Timbers Dr
- 230 Hovenkamp St
- 602 San Clemente Dr
- 645 E Hill St
- 133 Minnie St
- 219 E Vine St
- 201 and 207 Ruby St
- 718 Pacific Grove Dr
- 300 Cindy Ct
- 724 E Hill St
- 735 E Hill St
- 317 Sioux St
- 705 Brookstone Ct
Your Personal Tour Guide
Ask me questions while you tour the home.