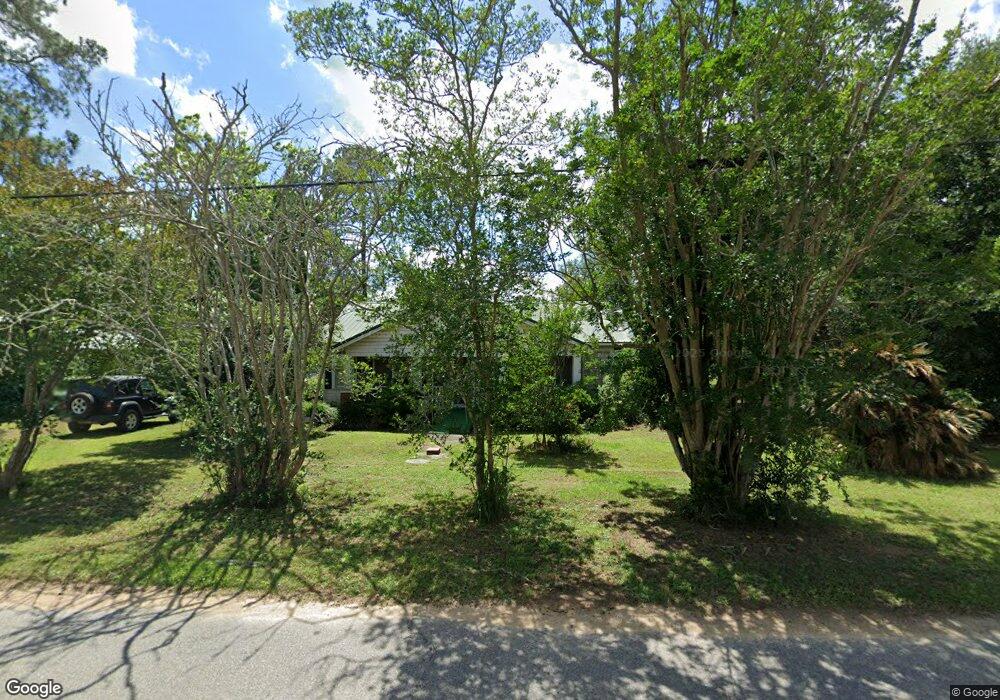
433 Massey St Barwick, GA 31720
Estimated Value: $125,985 - $161,000
--
Bed
--
Bath
1,404
Sq Ft
$102/Sq Ft
Est. Value
About This Home
This home is located at 433 Massey St, Barwick, GA 31720 and is currently estimated at $143,493, approximately $102 per square foot. 433 Massey St is a home with nearby schools including North Brooks Elementary School.
Ownership History
Date
Name
Owned For
Owner Type
Purchase Details
Closed on
Oct 11, 1994
Sold by
Carter Mrs Ella J
Bought by
Baker Kenneth C and Baker B
Current Estimated Value
Create a Home Valuation Report for This Property
The Home Valuation Report is an in-depth analysis detailing your home's value as well as a comparison with similar homes in the area
Home Values in the Area
Average Home Value in this Area
Purchase History
| Date | Buyer | Sale Price | Title Company |
|---|---|---|---|
| Baker Kenneth C | $16,000 | -- |
Source: Public Records
Tax History Compared to Growth
Tax History
| Year | Tax Paid | Tax Assessment Tax Assessment Total Assessment is a certain percentage of the fair market value that is determined by local assessors to be the total taxable value of land and additions on the property. | Land | Improvement |
|---|---|---|---|---|
| 2024 | $1,306 | $36,240 | $8,320 | $27,920 |
| 2023 | $1,084 | $33,560 | $8,320 | $25,240 |
| 2022 | $920 | $33,124 | $8,240 | $24,884 |
| 2021 | $715 | $27,128 | $5,080 | $22,048 |
| 2020 | $1,145 | $27,372 | $5,080 | $22,292 |
| 2019 | $650 | $26,140 | $5,160 | $20,980 |
| 2018 | $1,109 | $25,744 | $4,760 | $20,984 |
| 2017 | $613 | $24,668 | $4,760 | $19,908 |
| 2016 | $618 | $25,032 | $4,760 | $20,272 |
| 2015 | -- | $25,088 | $4,760 | $20,328 |
| 2014 | -- | $25,088 | $4,760 | $20,328 |
| 2013 | -- | $25,088 | $4,760 | $20,328 |
Source: Public Records
Map
Nearby Homes