Estimated Value: $423,588 - $486,000
4
Beds
2
Baths
1,861
Sq Ft
$248/Sq Ft
Est. Value
About This Home
This home is located at 433 Mickleton Loop, Ocoee, FL 34761 and is currently estimated at $462,397, approximately $248 per square foot. 433 Mickleton Loop is a home located in Orange County with nearby schools including Westbrooke Elementary School, Sunridge Middle School, and West Orange High School.
Ownership History
Date
Name
Owned For
Owner Type
Purchase Details
Closed on
Jun 8, 2001
Sold by
Brent Pirie M and Pirie M Sandra K
Bought by
Pirie Brent
Current Estimated Value
Purchase Details
Closed on
Jul 14, 1999
Sold by
Doulton Nicholas P and Doulton Lisbeth A
Bought by
Pirie Brent and Pirie Sandra K
Home Financials for this Owner
Home Financials are based on the most recent Mortgage that was taken out on this home.
Original Mortgage
$126,000
Interest Rate
7.43%
Mortgage Type
New Conventional
Purchase Details
Closed on
Aug 21, 1997
Sold by
Calton Homes Of Florida Inc
Bought by
Romagnano Nicholas P and Romagnano Lisbeth A
Home Financials for this Owner
Home Financials are based on the most recent Mortgage that was taken out on this home.
Original Mortgage
$108,550
Interest Rate
7.5%
Mortgage Type
New Conventional
Create a Home Valuation Report for This Property
The Home Valuation Report is an in-depth analysis detailing your home's value as well as a comparison with similar homes in the area
Home Values in the Area
Average Home Value in this Area
Purchase History
| Date | Buyer | Sale Price | Title Company |
|---|---|---|---|
| Pirie Brent | -- | -- | |
| Pirie Brent | $144,000 | -- | |
| Romagnano Nicholas P | $121,400 | -- |
Source: Public Records
Mortgage History
| Date | Status | Borrower | Loan Amount |
|---|---|---|---|
| Open | Romagnano Nicholas P | $142,200 | |
| Previous Owner | Romagnano Nicholas P | $126,000 | |
| Previous Owner | Romagnano Nicholas P | $108,550 |
Source: Public Records
Tax History
| Year | Tax Paid | Tax Assessment Tax Assessment Total Assessment is a certain percentage of the fair market value that is determined by local assessors to be the total taxable value of land and additions on the property. | Land | Improvement |
|---|---|---|---|---|
| 2025 | $2,901 | $178,671 | -- | -- |
| 2024 | $2,554 | $173,636 | -- | -- |
| 2023 | $2,554 | $163,827 | $0 | $0 |
| 2022 | $2,464 | $159,055 | $0 | $0 |
| 2021 | $2,433 | $154,422 | $0 | $0 |
| 2020 | $2,323 | $152,290 | $0 | $0 |
| 2019 | $2,400 | $148,866 | $0 | $0 |
| 2018 | $2,388 | $146,090 | $0 | $0 |
| 2017 | $2,371 | $191,700 | $50,000 | $141,700 |
| 2016 | $2,373 | $187,464 | $50,000 | $137,464 |
| 2015 | $2,410 | $177,299 | $50,000 | $127,299 |
| 2014 | $2,395 | $174,115 | $50,000 | $124,115 |
Source: Public Records
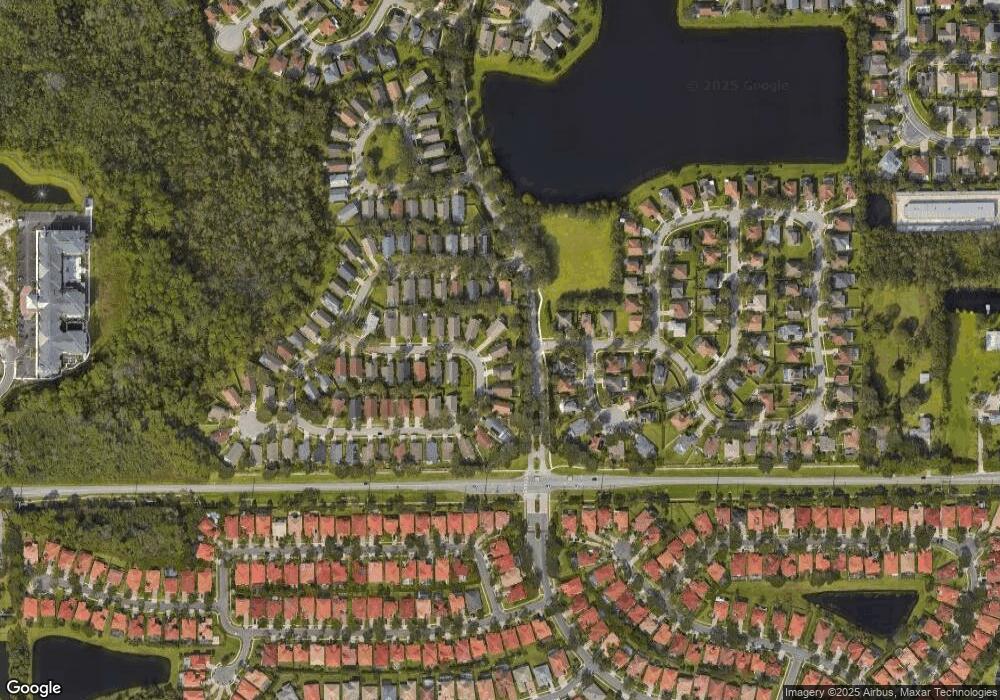
Map
Nearby Homes
- 457 Mickleton Loop
- 469 Mickleton Loop
- 272 Longhirst Loop
- 11410 Rapallo Ln
- 2316 Blackjack Oak St
- 934 Roberson Rd
- 2254 Blackjack Oak St
- 815 Grovesmere Loop
- 11714 Delwick Dr
- 44 Heather Green Ct
- 1238 Lake Whitney Dr
- 1361 Whitney Isles Dr
- 814 Windergrove Ct
- 841 Grovesmere Loop
- 660 Chester Pines Ct Unit 3
- 1369 Glenwick Dr
- 214 Highbrooke Blvd
- 586 Huntington Pines Dr
- 237 White Dogwood Ln
- 84 Braelock Dr
- 439 Mickleton Loop
- 427 Mickleton Loop
- 425 Mickleton Loop
- 445 Mickleton Loop
- 426 Mickleton Loop
- 421 Mickleton Loop
- 451 Mickleton Loop
- 402 Dunoon St
- 410 Dunoon St
- 424 Dunoon St
- 417 Mickleton Loop
- 420 Mickleton Loop
- 357 Kirkhill St
- 460 Mickleton Loop
- 432 Dunoon St
- 2677 Glenbuck Ct
- 413 Mickleton Loop
- 416 Mickleton Loop
- 444 Dunoon St
Your Personal Tour Guide
Ask me questions while you tour the home.