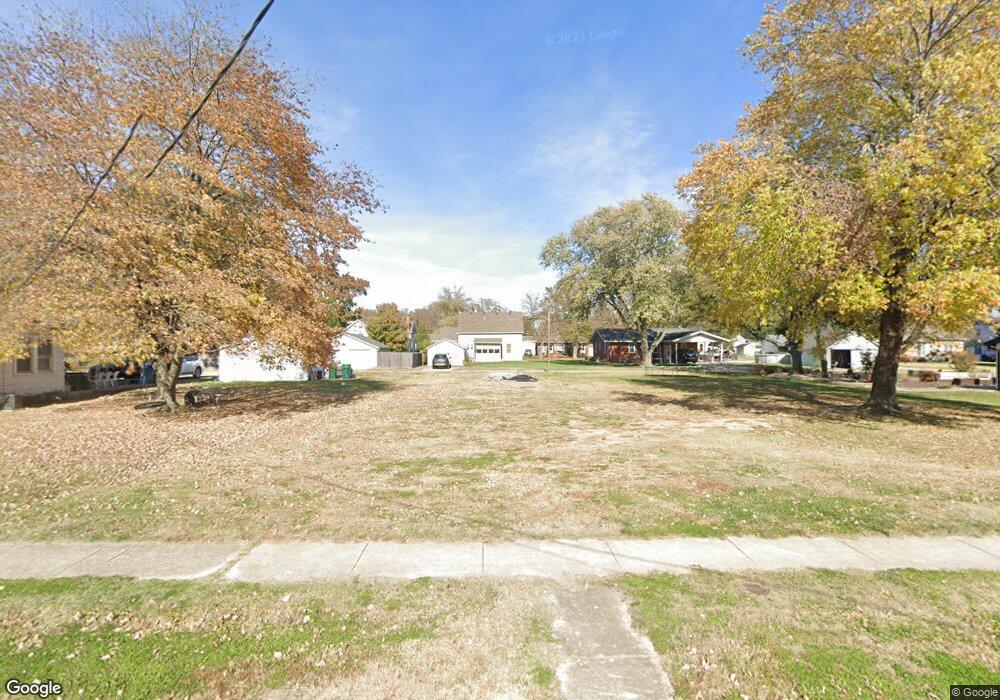
433 N 5th St Breese, IL 62230
Estimated Value: $56,000 - $184,000
Studio
1
Bath
1,568
Sq Ft
$81/Sq Ft
Est. Value
About This Home
This home is located at 433 N 5th St, Breese, IL 62230 and is currently estimated at $127,266, approximately $81 per square foot. 433 N 5th St is a home located in Clinton County with nearby schools including Breese ESD #12, Beckemeyer Elementary School, and Central Community High School.
Ownership History
Date
Name
Owned For
Owner Type
Purchase Details
Closed on
Aug 17, 2023
Sold by
Thole Kenneth J
Bought by
Isaak Colby
Current Estimated Value
Home Financials for this Owner
Home Financials are based on the most recent Mortgage that was taken out on this home.
Original Mortgage
$24,000
Outstanding Balance
$23,468
Interest Rate
6.96%
Mortgage Type
New Conventional
Estimated Equity
$103,798
Purchase Details
Closed on
Apr 28, 2015
Sold by
Baer Martha I
Bought by
Thole Kenneth J
Home Financials for this Owner
Home Financials are based on the most recent Mortgage that was taken out on this home.
Original Mortgage
$58,400
Interest Rate
3.9%
Mortgage Type
Unknown
Create a Home Valuation Report for This Property
The Home Valuation Report is an in-depth analysis detailing your home's value as well as a comparison with similar homes in the area
Home Values in the Area
Average Home Value in this Area
Purchase History
| Date | Buyer | Sale Price | Title Company |
|---|---|---|---|
| Isaak Colby | $30,000 | None Available | |
| Thole Kenneth J | $63,000 | None Available |
Source: Public Records
Mortgage History
| Date | Status | Borrower | Loan Amount |
|---|---|---|---|
| Open | Isaak Colby | $24,000 | |
| Previous Owner | Thole Kenneth J | $58,400 |
Source: Public Records
Tax History
| Year | Tax Paid | Tax Assessment Tax Assessment Total Assessment is a certain percentage of the fair market value that is determined by local assessors to be the total taxable value of land and additions on the property. | Land | Improvement |
|---|---|---|---|---|
| 2024 | $894 | $13,000 | $13,000 | $0 |
| 2023 | $890 | $12,260 | $12,260 | $0 |
| 2022 | $890 | $30,290 | $11,150 | $19,140 |
| 2021 | $2,210 | $28,850 | $10,620 | $18,230 |
| 2020 | $2,173 | $27,740 | $10,210 | $17,530 |
| 2019 | $2,140 | $27,740 | $10,210 | $17,530 |
| 2018 | $2,427 | $29,848 | $8,642 | $21,206 |
| 2017 | $2,363 | $28,700 | $8,310 | $20,390 |
| 2016 | $2,350 | $28,700 | $8,310 | $20,390 |
| 2015 | -- | $28,700 | $8,310 | $20,390 |
| 2013 | -- | $28,690 | $8,310 | $20,380 |
Source: Public Records
Map
Nearby Homes
Your Personal Tour Guide
Ask me questions while you tour the home.