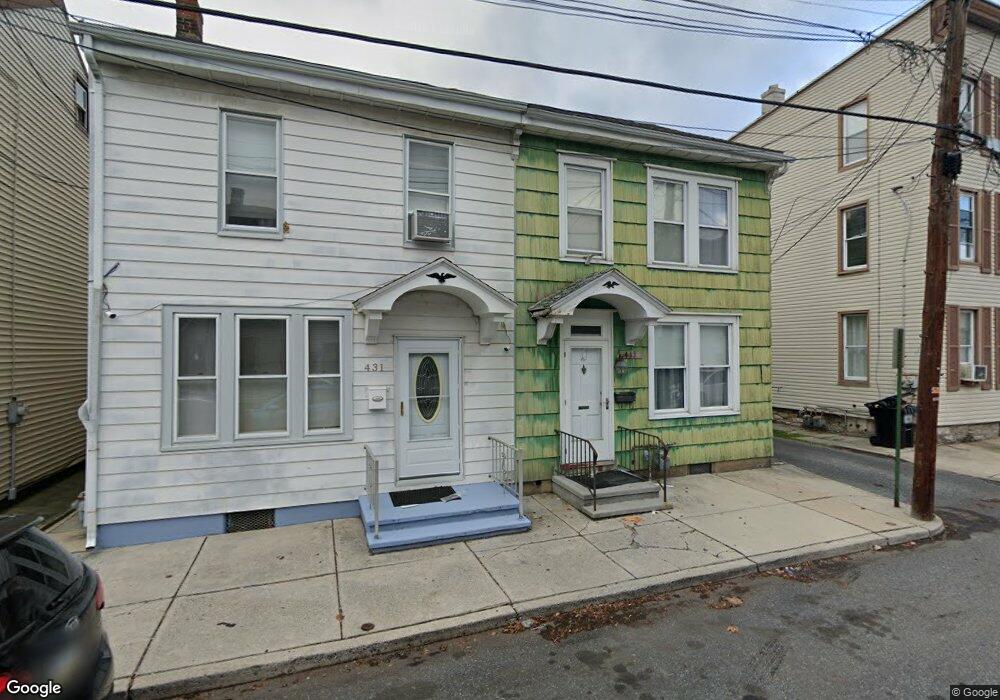
433 N 6th St Lebanon, PA 17046
Estimated Value: $158,000 - $167,166
3
Beds
2
Baths
1,392
Sq Ft
$117/Sq Ft
Est. Value
About This Home
This home is located at 433 N 6th St, Lebanon, PA 17046 and is currently estimated at $163,292, approximately $117 per square foot. 433 N 6th St is a home located in Lebanon County with nearby schools including Harding Elementary School, Houck Elementary School, and Northwest Elementary School.
Ownership History
Date
Name
Owned For
Owner Type
Purchase Details
Closed on
May 23, 2019
Sold by
Renderos Mario N
Bought by
Garcia Arias Maria Rudie
Current Estimated Value
Purchase Details
Closed on
Jan 11, 2017
Sold by
Renderos Mario N
Bought by
Renderos Mario N and Garcia Arias Maria Rudie
Purchase Details
Closed on
Dec 2, 2005
Sold by
Arnold Robert C and Arnold Elizabeth J
Bought by
Renderos Mario N
Home Financials for this Owner
Home Financials are based on the most recent Mortgage that was taken out on this home.
Original Mortgage
$69,351
Interest Rate
6.14%
Mortgage Type
FHA
Create a Home Valuation Report for This Property
The Home Valuation Report is an in-depth analysis detailing your home's value as well as a comparison with similar homes in the area
Home Values in the Area
Average Home Value in this Area
Purchase History
| Date | Buyer | Sale Price | Title Company |
|---|---|---|---|
| Garcia Arias Maria Rudie | $38,110 | None Available | |
| Renderos Mario N | $34,780 | Attorney | |
| Renderos Mario N | $69,900 | Edge Abstract |
Source: Public Records
Mortgage History
| Date | Status | Borrower | Loan Amount |
|---|---|---|---|
| Previous Owner | Renderos Mario N | $69,351 |
Source: Public Records
Tax History Compared to Growth
Tax History
| Year | Tax Paid | Tax Assessment Tax Assessment Total Assessment is a certain percentage of the fair market value that is determined by local assessors to be the total taxable value of land and additions on the property. | Land | Improvement |
|---|---|---|---|---|
| 2025 | $2,384 | $74,000 | $7,600 | $66,400 |
| 2024 | $2,271 | $74,000 | $7,600 | $66,400 |
| 2023 | $2,271 | $74,000 | $7,600 | $66,400 |
| 2022 | $2,234 | $74,000 | $7,600 | $66,400 |
| 2021 | $2,158 | $74,000 | $7,600 | $66,400 |
| 2020 | $2,158 | $74,000 | $7,600 | $66,400 |
| 2019 | $2,127 | $74,000 | $7,600 | $66,400 |
| 2018 | $2,066 | $74,000 | $7,600 | $66,400 |
| 2017 | $583 | $74,000 | $7,600 | $66,400 |
| 2016 | $2,011 | $74,000 | $7,600 | $66,400 |
| 2015 | $1,382 | $74,000 | $7,600 | $66,400 |
| 2014 | $1,382 | $74,000 | $7,600 | $66,400 |
Source: Public Records
Map
Nearby Homes