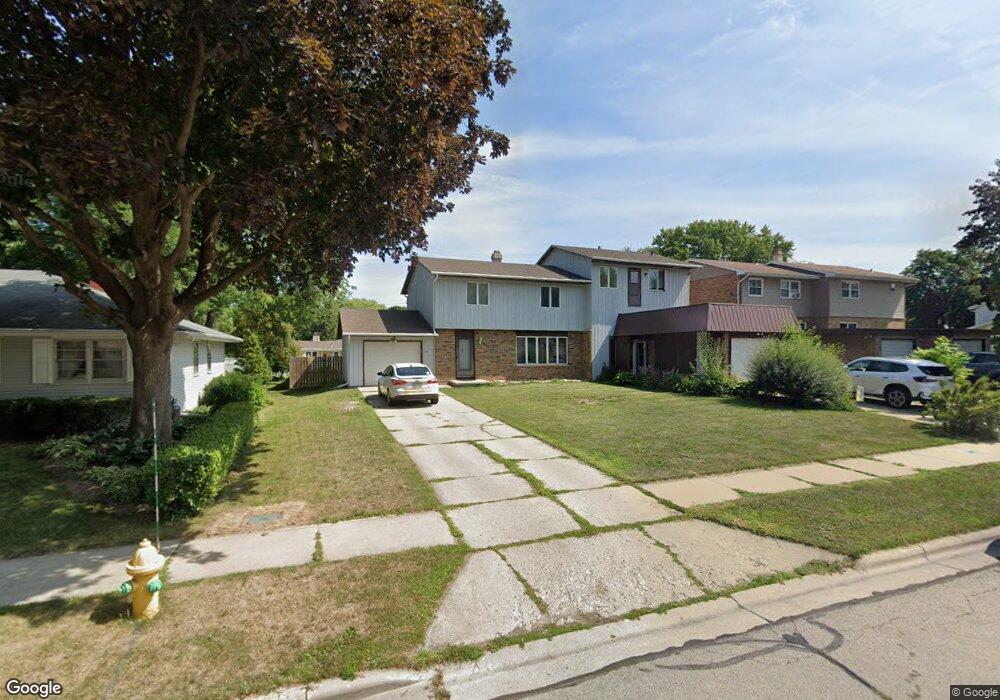
433 N Saint Bernard Dr Unit 435 de Pere, WI 54115
Estimated Value: $356,000 - $381,000
5
Beds
4
Baths
2,640
Sq Ft
$140/Sq Ft
Est. Value
About This Home
This home is located at 433 N Saint Bernard Dr Unit 435, de Pere, WI 54115 and is currently estimated at $369,474, approximately $139 per square foot. 433 N Saint Bernard Dr Unit 435 is a home located in Brown County with nearby schools including Susie C. Altmayer Elementary School, Foxview Intermediate School, and De Pere Middle School.
Ownership History
Date
Name
Owned For
Owner Type
Purchase Details
Closed on
Feb 12, 2021
Sold by
Wiskes Dustin A and Wiskes Brittni L
Bought by
Wiskes Rentals Llc
Current Estimated Value
Purchase Details
Closed on
Apr 9, 2019
Sold by
Watson And Moran Llc
Bought by
Wiskes Dustin A and Wiskes Brittni L
Home Financials for this Owner
Home Financials are based on the most recent Mortgage that was taken out on this home.
Original Mortgage
$179,032
Interest Rate
4.3%
Mortgage Type
VA
Purchase Details
Closed on
Apr 16, 2014
Sold by
Watson Gerald F
Bought by
Watson & Moran Llc
Home Financials for this Owner
Home Financials are based on the most recent Mortgage that was taken out on this home.
Original Mortgage
$25,666
Interest Rate
4.33%
Mortgage Type
New Conventional
Create a Home Valuation Report for This Property
The Home Valuation Report is an in-depth analysis detailing your home's value as well as a comparison with similar homes in the area
Home Values in the Area
Average Home Value in this Area
Purchase History
| Date | Buyer | Sale Price | Title Company |
|---|---|---|---|
| Wiskes Rentals Llc | -- | None Available | |
| Wiskes Dustin A | $185,300 | Liberty Title | |
| Watson & Moran Llc | -- | Liberty Title |
Source: Public Records
Mortgage History
| Date | Status | Borrower | Loan Amount |
|---|---|---|---|
| Previous Owner | Wiskes Dustin A | $179,032 | |
| Previous Owner | Watson & Moran Llc | $25,666 |
Source: Public Records
Tax History Compared to Growth
Tax History
| Year | Tax Paid | Tax Assessment Tax Assessment Total Assessment is a certain percentage of the fair market value that is determined by local assessors to be the total taxable value of land and additions on the property. | Land | Improvement |
|---|---|---|---|---|
| 2024 | $4,258 | $284,700 | $37,100 | $247,600 |
| 2023 | $3,569 | $247,400 | $37,100 | $210,300 |
| 2022 | $3,361 | $222,700 | $37,100 | $185,600 |
| 2021 | $3,175 | $198,700 | $30,900 | $167,800 |
| 2020 | $3,203 | $185,300 | $30,900 | $154,400 |
| 2019 | $3,312 | $174,200 | $30,900 | $143,300 |
| 2018 | $3,645 | $168,600 | $30,900 | $137,700 |
| 2017 | $3,397 | $153,400 | $30,900 | $122,500 |
| 2016 | $3,460 | $153,400 | $30,900 | $122,500 |
| 2015 | $4,047 | $164,100 | $32,900 | $131,200 |
| 2014 | $4,241 | $164,100 | $32,900 | $131,200 |
| 2013 | $4,241 | $164,100 | $32,900 | $131,200 |
Source: Public Records
Map
Nearby Homes
- 830 S Superior St Unit 832
- 717 4th St
- 806 4th St
- 1120 Cardinal St
- 416 Lansdowne St
- 410 Battery Ave
- 363 Battery Ave
- 1611 N Honeysuckle Cir
- 305 Battery Ave
- 385 Battery Ave
- 413 Brookline Ave
- 337 Battery Ave
- 400 Battery Ave
- 318 S Webster Ave
- 1144 Jordan Rd
- 1861 Chicago St
- 634 Grant St
- 555 Main Ave Unit 110
- 555 Main Ave Unit 104
- 555 Main Ave Unit 111
- 435 N Saint Bernard Dr
- 433 N St Bernard
- 437 N Saint Bernard Dr Unit 439
- 429 N Saint Bernard Dr
- 441 N Saint Bernard Dr Unit 443
- 438 Wilcox Ct
- 432 Wilcox Ct
- 442 Wilcox Ct
- 425 N Saint Bernard Dr Unit 427
- 428 Wilcox Ct
- 432 N Saint Bernard Dr Unit 434
- 438 N St Bernard Dr
- 428 N Saint Bernard Dr
- 438 N Saint Bernard Dr Unit 440
- 445 N Saint Bernard Dr Unit 447
- 445 N St Bernard Dr
- 446 Wilcox Ct
- 438 St Bernard St
- 424 N St Bernard
- 422 Wilcox Ct