433 Old Tavern Rd Hunlock Creek, PA 18621
Estimated Value: $355,000 - $422,547
4
Beds
4
Baths
3,138
Sq Ft
$128/Sq Ft
Est. Value
About This Home
This home is located at 433 Old Tavern Rd, Hunlock Creek, PA 18621 and is currently estimated at $400,887, approximately $127 per square foot. 433 Old Tavern Rd is a home located in Luzerne County with nearby schools including Northwest Area Intermediate School and Northwest Area High School.
Ownership History
Date
Name
Owned For
Owner Type
Purchase Details
Closed on
Sep 9, 2024
Sold by
Robinson Russell Charles and Robinson Tammy Lynn
Bought by
Frey Lance M
Current Estimated Value
Home Financials for this Owner
Home Financials are based on the most recent Mortgage that was taken out on this home.
Original Mortgage
$310,800
Outstanding Balance
$307,507
Interest Rate
6.78%
Mortgage Type
New Conventional
Estimated Equity
$93,380
Purchase Details
Closed on
Nov 1, 2016
Sold by
Wells Fargo Bank Na
Bought by
Robinson Russell Charles and Robinson Tammy Lynn
Purchase Details
Closed on
Jun 23, 2016
Sold by
Souder Jason C and Souder April
Bought by
Wells Fargo Bank Na
Purchase Details
Closed on
May 30, 2013
Sold by
Garren Bryan and Garren Stephanie
Bought by
Souder Jason C and Souder April
Home Financials for this Owner
Home Financials are based on the most recent Mortgage that was taken out on this home.
Original Mortgage
$265,109
Interest Rate
3.5%
Mortgage Type
FHA
Create a Home Valuation Report for This Property
The Home Valuation Report is an in-depth analysis detailing your home's value as well as a comparison with similar homes in the area
Home Values in the Area
Average Home Value in this Area
Purchase History
| Date | Buyer | Sale Price | Title Company |
|---|---|---|---|
| Frey Lance M | $370,000 | None Listed On Document | |
| Frey Lance M | $370,000 | None Listed On Document | |
| Robinson Russell Charles | $126,000 | Linear Title & Closing Ltd | |
| Wells Fargo Bank Na | $1,547 | None Available | |
| Souder Jason C | $270,000 | None Available |
Source: Public Records
Mortgage History
| Date | Status | Borrower | Loan Amount |
|---|---|---|---|
| Open | Frey Lance M | $310,800 | |
| Closed | Frey Lance M | $310,800 | |
| Previous Owner | Souder Jason C | $265,109 |
Source: Public Records
Tax History Compared to Growth
Tax History
| Year | Tax Paid | Tax Assessment Tax Assessment Total Assessment is a certain percentage of the fair market value that is determined by local assessors to be the total taxable value of land and additions on the property. | Land | Improvement |
|---|---|---|---|---|
| 2025 | $5,700 | $261,100 | $42,500 | $218,600 |
| 2024 | $5,460 | $261,100 | $42,500 | $218,600 |
| 2023 | $5,141 | $261,100 | $42,500 | $218,600 |
| 2022 | $5,093 | $261,100 | $42,500 | $218,600 |
| 2021 | $4,973 | $261,100 | $42,500 | $218,600 |
| 2020 | $4,872 | $261,100 | $42,500 | $218,600 |
| 2019 | $4,734 | $261,100 | $42,500 | $218,600 |
| 2018 | $4,734 | $261,100 | $42,500 | $218,600 |
| 2017 | $4,552 | $253,300 | $42,500 | $210,800 |
| 2016 | -- | $253,300 | $42,500 | $210,800 |
| 2015 | $3,545 | $253,300 | $42,500 | $210,800 |
| 2014 | $3,545 | $253,300 | $42,500 | $210,800 |
Source: Public Records
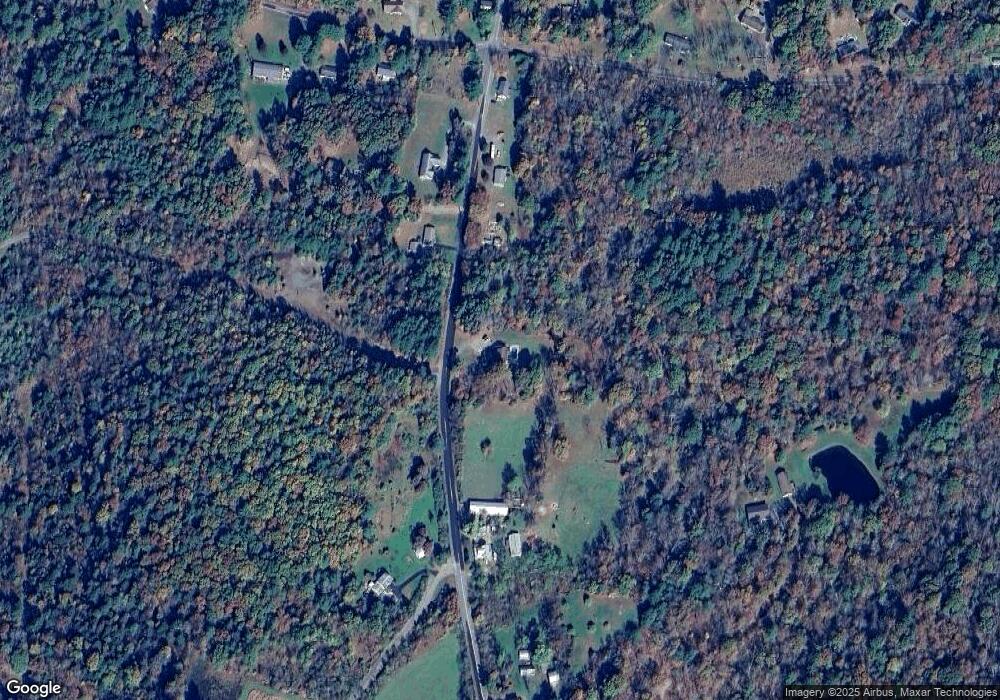
Map
Nearby Homes
- 0 Sweet Valley Rd
- 71 Benscoter Ave
- 5240 Main Rd
- 70 Sweet Valley Rd
- 0 Hunlock-Harveyville Rd
- 0 Swamp Rd
- 983 Swamp Rd
- 641 Sorbertown Hill Rd
- 205 Post Office Rd
- 21 Eleanor Dr
- 46 Country Crest Ln
- 10 Apache Dr
- 1620 Main Rd
- 73 Adams Dr
- 0 Apache Dr
- 85 Sorbertown Hill Rd
- 61 Sorbertown Hill Rd
- 1842 Pennsylvania 118
- 0 Moon Lake Rd
- 107 White Oak Dr
- 447 Old Tavern Rd
- 446 Old Tavern Rd
- 453 Old Tavern Rd
- 409 Old Tavern Rd
- 454 Old Tavern Rd
- 5 Pine Valley Dr
- 463 Old Tavern Rd
- 393 Old Tavern Rd
- 546 Prichards Rd
- 552 Prichards Rd
- 560 Pritchards Rd
- 2 Gravel Rd
- 5 Gravel Rd
- 515 Prichards Rd
- 547 Prichards Rd
- 560 Prichards Rd
- 7 Gravel Rd
- 507 Prichards Rd
- 493 Prichards Rd
- 380 Old Tavern Rd