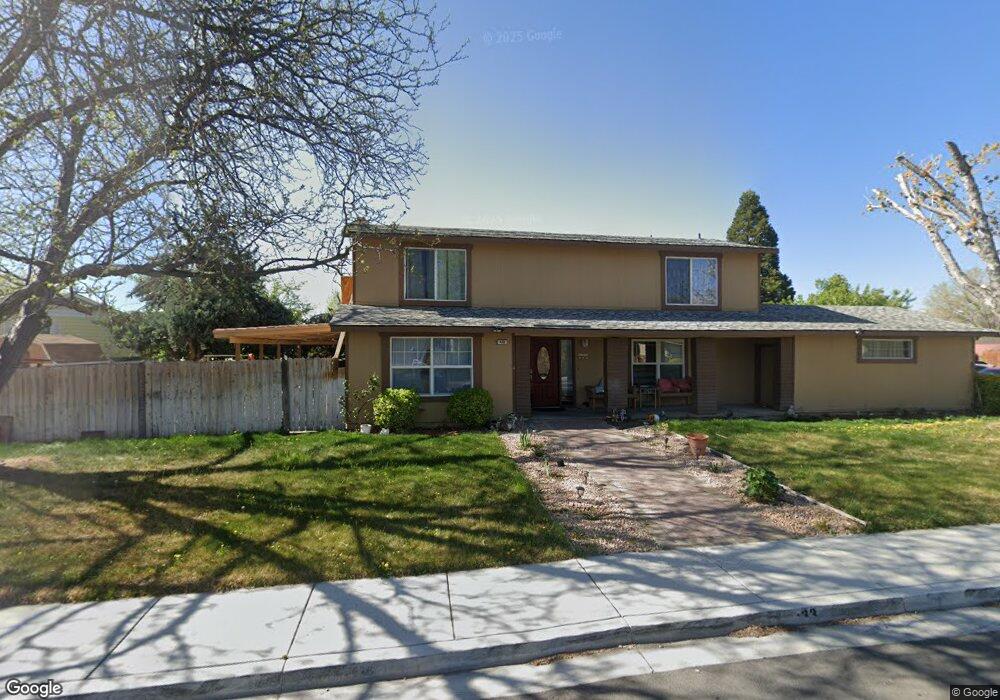
433 Penny Way Sparks, NV 89431
McCarran Boulevard-Probasco NeighborhoodEstimated Value: $468,000 - $520,000
4
Beds
3
Baths
2,002
Sq Ft
$249/Sq Ft
Est. Value
About This Home
This home is located at 433 Penny Way, Sparks, NV 89431 and is currently estimated at $499,041, approximately $249 per square foot. 433 Penny Way is a home located in Washoe County with nearby schools including Hershal H. Beam Elementary School, Lena Juniper Elementary School, and Lou Mendive Middle School.
Ownership History
Date
Name
Owned For
Owner Type
Purchase Details
Closed on
Apr 11, 2005
Sold by
Hinds John and Hinds Carla
Bought by
Munoz Rodriguez Paulino and Munoz De Rodriguez Consuelo
Current Estimated Value
Home Financials for this Owner
Home Financials are based on the most recent Mortgage that was taken out on this home.
Original Mortgage
$274,400
Outstanding Balance
$141,510
Interest Rate
5.77%
Mortgage Type
Fannie Mae Freddie Mac
Estimated Equity
$357,531
Purchase Details
Closed on
Apr 8, 2005
Sold by
Hinds Rachelle Marie
Bought by
Hinds John and Hinds Carla
Home Financials for this Owner
Home Financials are based on the most recent Mortgage that was taken out on this home.
Original Mortgage
$274,400
Outstanding Balance
$141,510
Interest Rate
5.77%
Mortgage Type
Fannie Mae Freddie Mac
Estimated Equity
$357,531
Purchase Details
Closed on
Jan 18, 2005
Sold by
Dericco Ernest A and Dericco Vicky J
Bought by
Hinds Rachelle Marie
Home Financials for this Owner
Home Financials are based on the most recent Mortgage that was taken out on this home.
Original Mortgage
$295,000
Interest Rate
9.97%
Mortgage Type
Unknown
Create a Home Valuation Report for This Property
The Home Valuation Report is an in-depth analysis detailing your home's value as well as a comparison with similar homes in the area
Home Values in the Area
Average Home Value in this Area
Purchase History
| Date | Buyer | Sale Price | Title Company |
|---|---|---|---|
| Munoz Rodriguez Paulino | $345,500 | Western Title Incorporated | |
| Hinds John | -- | Western Title Incorporated | |
| Hinds Rachelle Marie | $295,000 | Stewart Title Of Northern Nv |
Source: Public Records
Mortgage History
| Date | Status | Borrower | Loan Amount |
|---|---|---|---|
| Open | Munoz Rodriguez Paulino | $274,400 | |
| Previous Owner | Hinds Rachelle Marie | $295,000 |
Source: Public Records
Tax History Compared to Growth
Tax History
| Year | Tax Paid | Tax Assessment Tax Assessment Total Assessment is a certain percentage of the fair market value that is determined by local assessors to be the total taxable value of land and additions on the property. | Land | Improvement |
|---|---|---|---|---|
| 2025 | $1,447 | $67,433 | $38,551 | $28,883 |
| 2024 | $1,447 | $64,941 | $36,493 | $28,448 |
| 2023 | $1,016 | $63,038 | $36,677 | $26,361 |
| 2022 | $1,365 | $51,384 | $29,878 | $21,506 |
| 2021 | $1,326 | $41,568 | $20,617 | $20,951 |
| 2020 | $1,286 | $39,306 | $18,743 | $20,563 |
| 2019 | $1,249 | $40,369 | $19,661 | $20,708 |
| 2018 | $1,214 | $35,215 | $14,222 | $20,993 |
| 2017 | $1,180 | $34,414 | $12,679 | $21,735 |
| 2016 | $1,148 | $34,820 | $12,128 | $22,692 |
| 2015 | $1,146 | $33,306 | $9,886 | $23,420 |
| 2014 | $1,114 | $31,476 | $8,379 | $23,097 |
| 2013 | -- | $29,641 | $6,284 | $23,357 |
Source: Public Records
Map
Nearby Homes
- 3465 Dawn Cir
- 3245 Elaine Way
- 465 Lenwood Dr
- 780 Emerson Way
- 3545 4th St
- 3607 Keogh Dr
- 119 Devere Way
- 5650 Wedekind Rd
- 120 E Lenwood Dr
- 3595 Rocky Ridge Ct
- 3252 Holman Way
- 10 Sheridan Way
- 2865 Patrice Dr
- 3269 Valley Forge Way
- 3071 Meadowlands Dr
- 5530 High Rock Way
- 3104 Sandy St
- 3332 Shari Way
- 1125 Dodson Way
- 1940 4th St Unit 20