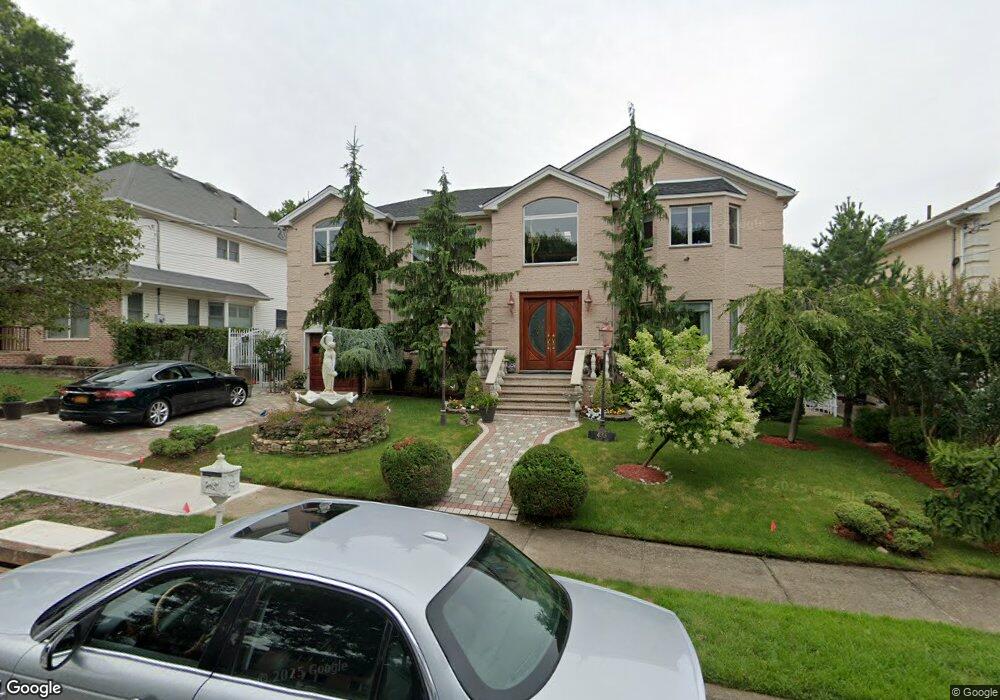
433 Philip Ave Staten Island, NY 10312
Huguenot NeighborhoodEstimated Value: $1,166,819 - $1,555,000
--
Bed
4
Baths
3,329
Sq Ft
$418/Sq Ft
Est. Value
About This Home
This home is located at 433 Philip Ave, Staten Island, NY 10312 and is currently estimated at $1,390,455, approximately $417 per square foot. 433 Philip Ave is a home located in Richmond County with nearby schools including P.S. 5 - Huguenot, I.S. 007 Elias Bernstein, and Tottenville High School.
Ownership History
Date
Name
Owned For
Owner Type
Purchase Details
Closed on
Jan 17, 2018
Sold by
Andreola Antoinette
Bought by
Andreola Michael and Andreola Antoinette
Current Estimated Value
Purchase Details
Closed on
Jun 21, 2010
Sold by
Andreola Michael and Andreola Antoinette
Bought by
Andreola Antoinette
Purchase Details
Closed on
Feb 24, 1998
Sold by
Savo Brothers Inc
Bought by
Andreola Michael and Andreola Antoinette
Home Financials for this Owner
Home Financials are based on the most recent Mortgage that was taken out on this home.
Original Mortgage
$275,000
Interest Rate
7.03%
Create a Home Valuation Report for This Property
The Home Valuation Report is an in-depth analysis detailing your home's value as well as a comparison with similar homes in the area
Home Values in the Area
Average Home Value in this Area
Purchase History
| Date | Buyer | Sale Price | Title Company |
|---|---|---|---|
| Andreola Michael | -- | None Available | |
| Andreola Antoinette | -- | None Available | |
| Andreola Michael | $445,500 | American Title Ins Co |
Source: Public Records
Mortgage History
| Date | Status | Borrower | Loan Amount |
|---|---|---|---|
| Closed | Andreola Michael | $275,000 |
Source: Public Records
Tax History Compared to Growth
Tax History
| Year | Tax Paid | Tax Assessment Tax Assessment Total Assessment is a certain percentage of the fair market value that is determined by local assessors to be the total taxable value of land and additions on the property. | Land | Improvement |
|---|---|---|---|---|
| 2025 | $11,662 | $69,720 | $12,711 | $57,009 |
| 2024 | $11,662 | $65,100 | $12,843 | $52,257 |
| 2023 | $11,669 | $57,456 | $11,444 | $46,012 |
| 2022 | $11,047 | $64,260 | $14,400 | $49,860 |
| 2021 | $11,441 | $67,740 | $14,400 | $53,340 |
| 2020 | $10,856 | $58,440 | $14,400 | $44,040 |
| 2019 | $10,121 | $54,540 | $14,400 | $40,140 |
| 2018 | $9,760 | $47,880 | $12,160 | $35,720 |
| 2017 | $9,408 | $46,152 | $14,201 | $31,951 |
| 2016 | $9,056 | $45,303 | $11,844 | $33,459 |
| 2015 | $7,738 | $42,739 | $10,698 | $32,041 |
| 2014 | $7,738 | $40,320 | $12,000 | $28,320 |
Source: Public Records
Map
Nearby Homes
- 393 Philip Ave
- 389 Philip Ave
- 350 Poillon Ave
- 383 Philip Ave
- 344 Poillon Ave
- 5 Nicolosi Dr
- 59 Newton St
- 16 Nicolosi Loop
- 84 Discala Ln
- 52 Nicolosi Loop
- 314 Bertram Ave
- 311 Bertram Ave
- 304 Bertram Ave
- 381 Arbutus Ave
- 115 Jansen St
- 21 Allen Place
- 155 Nicolosi Dr
- 140 Nicolosi Dr
- 161 Boardwalk Ave
- 262 Noel St