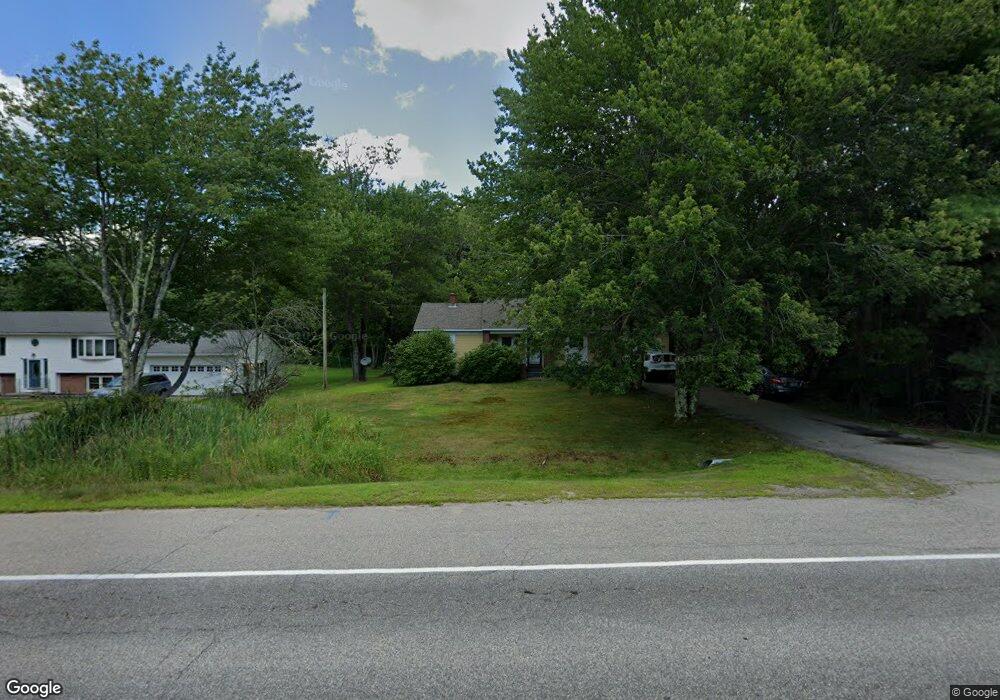
433 Pool St Biddeford, ME 04005
South Biddeford NeighborhoodEstimated Value: $392,814 - $545,000
3
Beds
1
Bath
1,362
Sq Ft
$330/Sq Ft
Est. Value
About This Home
This home is located at 433 Pool St, Biddeford, ME 04005 and is currently estimated at $448,954, approximately $329 per square foot. 433 Pool St is a home located in York County with nearby schools including John F Kennedy Memorial School, Biddeford Primary School, and Biddeford Intermediate School.
Ownership History
Date
Name
Owned For
Owner Type
Purchase Details
Closed on
Oct 3, 2022
Sold by
Day Kevin D and Day Donna M
Bought by
Ostrander Mark D and Ostrander Tiffany M
Current Estimated Value
Home Financials for this Owner
Home Financials are based on the most recent Mortgage that was taken out on this home.
Original Mortgage
$187,500
Outstanding Balance
$178,589
Interest Rate
5.55%
Mortgage Type
Purchase Money Mortgage
Estimated Equity
$270,365
Create a Home Valuation Report for This Property
The Home Valuation Report is an in-depth analysis detailing your home's value as well as a comparison with similar homes in the area
Home Values in the Area
Average Home Value in this Area
Purchase History
| Date | Buyer | Sale Price | Title Company |
|---|---|---|---|
| Ostrander Mark D | $250,000 | None Available |
Source: Public Records
Mortgage History
| Date | Status | Borrower | Loan Amount |
|---|---|---|---|
| Open | Ostrander Mark D | $187,500 |
Source: Public Records
Tax History
| Year | Tax Paid | Tax Assessment Tax Assessment Total Assessment is a certain percentage of the fair market value that is determined by local assessors to be the total taxable value of land and additions on the property. | Land | Improvement |
|---|---|---|---|---|
| 2025 | $4,129 | $276,400 | $167,500 | $108,900 |
| 2024 | $3,901 | $274,300 | $167,500 | $106,800 |
| 2023 | $3,558 | $271,200 | $164,400 | $106,800 |
| 2022 | $4,129 | $251,600 | $111,200 | $140,400 |
| 2021 | $3,444 | $213,900 | $94,000 | $119,900 |
| 2020 | $3,852 | $192,100 | $81,900 | $110,200 |
| 2019 | $3,838 | $192,100 | $81,900 | $110,200 |
| 2018 | $2,867 | $192,100 | $81,900 | $110,200 |
| 2017 | $3,564 | $177,600 | $81,900 | $95,700 |
| 2016 | $2,832 | $177,600 | $81,900 | $95,700 |
| 2015 | $3,263 | $177,600 | $81,900 | $95,700 |
| 2014 | $3,183 | $177,600 | $81,900 | $95,700 |
| 2013 | -- | $180,000 | $73,300 | $106,700 |
Source: Public Records
Map
Nearby Homes
- 5 Twin Island Dr
- 625 Pool St
- 650 Pool St
- 26 Meeting House Rd
- 74 Guinea Rd
- 378 Pool St
- 353 Pool St
- 4 Walker Dr Unit 101
- 3 Walker Dr Unit 101
- 3 Walker Dr Unit 101
- TBD 530 Ferry Rd
- 9 Windward Ridge
- 295 Ferry Rd
- 8 Rockwood Dr
- 18 Camp Ellis Ave
- 1 Main Ave
- 10 Lower Beach Rd
- 30 Vines Rd
- 6 Decary Rd
- 9 Riverside Ave
- 431 Pool St
- 1 Sokokis Rd
- 1 Crestwood Dr
- 45 Meeting House Rd
- 2 Sokokis Rd
- 2 Crestwood Dr
- 62 Meeting House Rd
- 1 Paquatanee Place
- 5 Crestwood Dr
- 3 Paquatanee Place
- 60 Meeting House Rd
- 41 Meeting House Rd
- 58 Meeting House Rd
- 4 Crestwood Dr
- 6 Sokokis Rd
- 58 Meetinghouse Rd
- 5 Paquatanee Place
- 427 Pool St
- 54 Meeting House Rd
Your Personal Tour Guide
Ask me questions while you tour the home.