Estimated Value: $197,000 - $229,000
About This Home
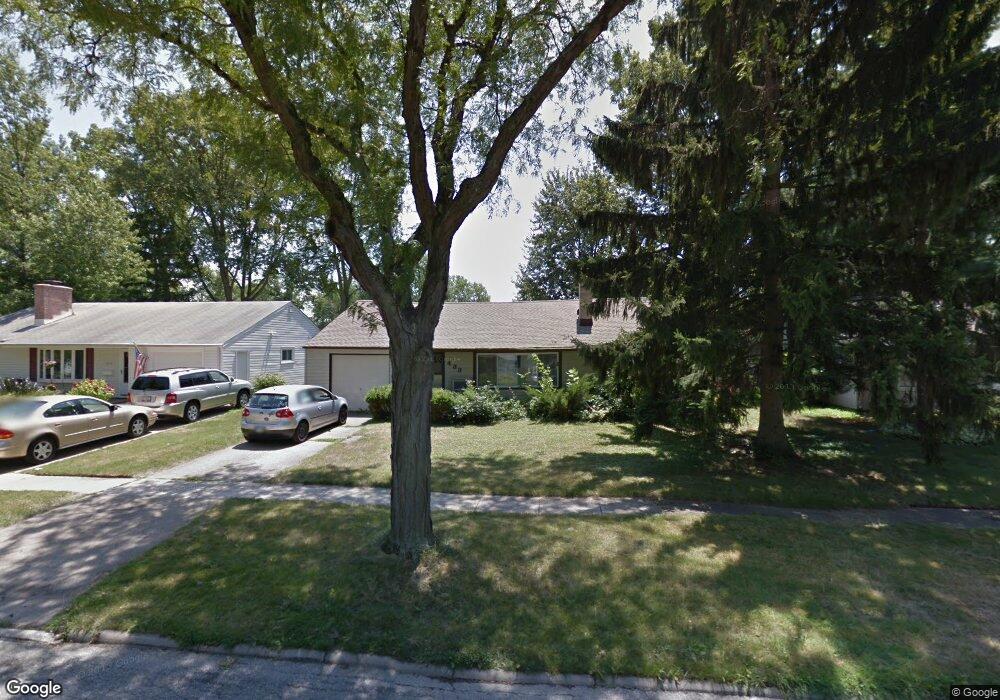
This home is located at 433 Race St, Berea, OH 44017 and is currently estimated at $213,189, approximately $179 per square foot. 433 Race St is a home located in Cuyahoga County with nearby schools including Grindstone Elementary School, Berea-Midpark Middle School, and Berea-Midpark High School.
Ownership History
We collect this data history from publicly available records. To have your information removed, we recommend requesting removal directly through your county’s website.
Purchase Details
Home Financials for this Owner
Home Financials are based on the most recent Mortgage that was taken out on this home.Purchase Details
Purchase Details
Purchase Details
Purchase Details
Home Values in the Area
Average Home Value in this Area
Purchase History
We collect this data history from publicly available records. To have your information removed, we recommend requesting removal directly through your county’s website.
| Date | Buyer | Sale Price | Title Company |
|---|---|---|---|
| $83,400 | Attorney | ||
| $69,900 | -- | ||
| $55,500 | -- | ||
| $47,000 | -- | ||
| -- | -- |
Mortgage History
We collect this data history from publicly available records. To have your information removed, we recommend requesting removal directly through your county’s website.
| Date | Status | Borrower | Loan Amount |
|---|---|---|---|
| Open | $65,400 |
Tax History
We collect this data history from publicly available records. To have your information removed, we recommend requesting removal directly through your county’s website.
| Year | Tax Paid | Tax Assessment Tax Assessment Total Assessment is a certain percentage of the fair market value that is determined by local assessors to be the total taxable value of land and additions on the property. | Land | Improvement |
|---|---|---|---|---|
| 2025 | $3,851 | $65,030 | $12,635 | $52,395 |
| 2024 | $3,847 | $65,030 | $12,635 | $52,395 |
| 2023 | $3,462 | $49,040 | $11,170 | $37,870 |
| 2022 | $3,824 | $49,040 | $11,170 | $37,870 |
| 2021 | $3,414 | $49,040 | $11,170 | $37,870 |
| 2020 | $3,261 | $41,550 | $9,450 | $32,100 |
| 2019 | $3,176 | $118,700 | $27,000 | $91,700 |
| 2018 | $3,449 | $41,550 | $9,450 | $32,100 |
| 2017 | $2,989 | $36,480 | $7,950 | $28,530 |
| 2016 | $2,967 | $36,480 | $7,950 | $28,530 |
| 2015 | $2,808 | $36,480 | $7,950 | $28,530 |
| 2014 | $2,808 | $36,480 | $7,950 | $28,530 |
Map
- 424 Race St
- 489 Race St
- 609 Wyleswood Dr
- 8975 Lindbergh Blvd
- 676 Wyleswood Dr
- 145 Edgewood Dr
- 233 Baldwin Dr
- 23174 Grist Mill Ct Unit 31A
- 23002 Chandlers Ln
- 23003 Chandlers Ln Unit 224
- 80 Hamilton St
- 23413 Grist Mill Ct Unit 4
- 522 Merrimak Dr
- 723 Trotter Ln
- 490 Abbyshire Dr
- 23004 Chandlers Ln Unit 114
- 73 Harnagy St
- 8757 Roberts Ct Unit 25C
- 8409 Forest View Dr
- 760 Trotter Ln
Ask me questions while you tour the home.