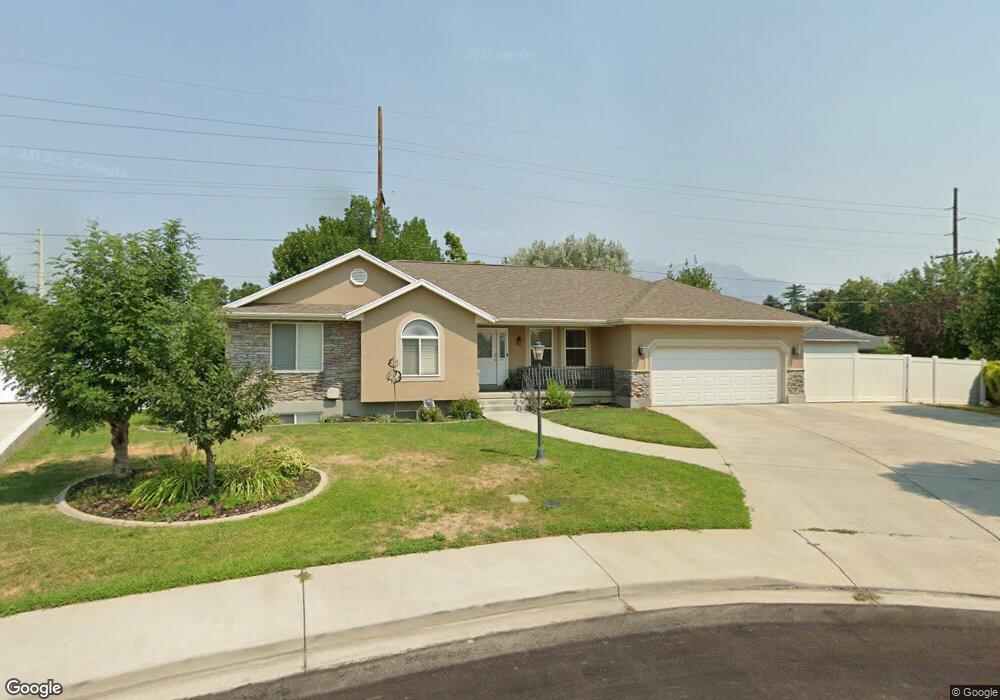
433 S 360 W Orem, UT 84058
Orem South NeighborhoodEstimated Value: $629,000 - $680,250
4
Beds
4
Baths
3,554
Sq Ft
$183/Sq Ft
Est. Value
About This Home
This home is located at 433 S 360 W, Orem, UT 84058 and is currently estimated at $651,417, approximately $183 per square foot. 433 S 360 W is a home located in Utah County with nearby schools including Orem Elementary School, Lakeridge Jr High School, and Mountain View High School.
Ownership History
Date
Name
Owned For
Owner Type
Purchase Details
Closed on
May 24, 2021
Sold by
Steeby David O
Bought by
Westrup Tom and Westrup Shawn
Current Estimated Value
Home Financials for this Owner
Home Financials are based on the most recent Mortgage that was taken out on this home.
Original Mortgage
$385,000
Outstanding Balance
$232,672
Interest Rate
3.1%
Mortgage Type
New Conventional
Estimated Equity
$418,745
Purchase Details
Closed on
Apr 30, 2019
Sold by
Strate Linda
Bought by
Steeby David O
Home Financials for this Owner
Home Financials are based on the most recent Mortgage that was taken out on this home.
Original Mortgage
$361,872
Interest Rate
4.3%
Mortgage Type
New Conventional
Purchase Details
Closed on
Mar 1, 2001
Sold by
Carter Construction Company
Bought by
Strate Linda
Create a Home Valuation Report for This Property
The Home Valuation Report is an in-depth analysis detailing your home's value as well as a comparison with similar homes in the area
Home Values in the Area
Average Home Value in this Area
Purchase History
| Date | Buyer | Sale Price | Title Company |
|---|---|---|---|
| Westrup Tom | -- | Old Republic Title | |
| Steeby David O | -- | Inwest Title Orem | |
| Strate Linda | -- | Century Title | |
| Carter Construction Company | -- | Century Title |
Source: Public Records
Mortgage History
| Date | Status | Borrower | Loan Amount |
|---|---|---|---|
| Open | Westrup Tom | $385,000 | |
| Previous Owner | Steeby David O | $361,872 |
Source: Public Records
Tax History
| Year | Tax Paid | Tax Assessment Tax Assessment Total Assessment is a certain percentage of the fair market value that is determined by local assessors to be the total taxable value of land and additions on the property. | Land | Improvement |
|---|---|---|---|---|
| 2025 | $2,692 | $341,495 | -- | -- |
| 2024 | $2,692 | $329,120 | $0 | $0 |
| 2023 | $2,528 | $332,255 | $0 | $0 |
| 2022 | $2,700 | $343,750 | $0 | $0 |
| 2021 | $2,585 | $498,600 | $209,800 | $288,800 |
| 2020 | $2,413 | $457,400 | $182,400 | $275,000 |
| 2019 | $2,252 | $443,800 | $182,400 | $261,400 |
| 2018 | $1,997 | $376,000 | $143,600 | $232,400 |
| 2017 | $1,910 | $192,720 | $0 | $0 |
| 2016 | $2,026 | $188,430 | $0 | $0 |
| 2015 | $2,079 | $182,875 | $0 | $0 |
| 2014 | $1,838 | $160,985 | $0 | $0 |
Source: Public Records
Map
Nearby Homes
- 433 S 360 W Unit O202
- 412 S 360 W Unit U201
- 414 S 360 W Unit U203
- 416 S 360 W Unit U101
- 418 S 360 W Unit U301
- 422 S 360 W Unit U303
- 377 W 400 S
- 436 S 360 W
- 424 S 360 W Unit U304
- 426 S 360 W Unit U302
- 426 S 360 W
- 428 S 360 W Unit U102
- 432 S 360 W Unit U204
- 434 S 360 W Unit U202
- 445 S 360 W
- 385 W 400 S
- 363 W 400 S
- 452 S 360 W
- 403 S 360 W Unit 707
- 407 S 360 W Unit 708
Your Personal Tour Guide
Ask me questions while you tour the home.