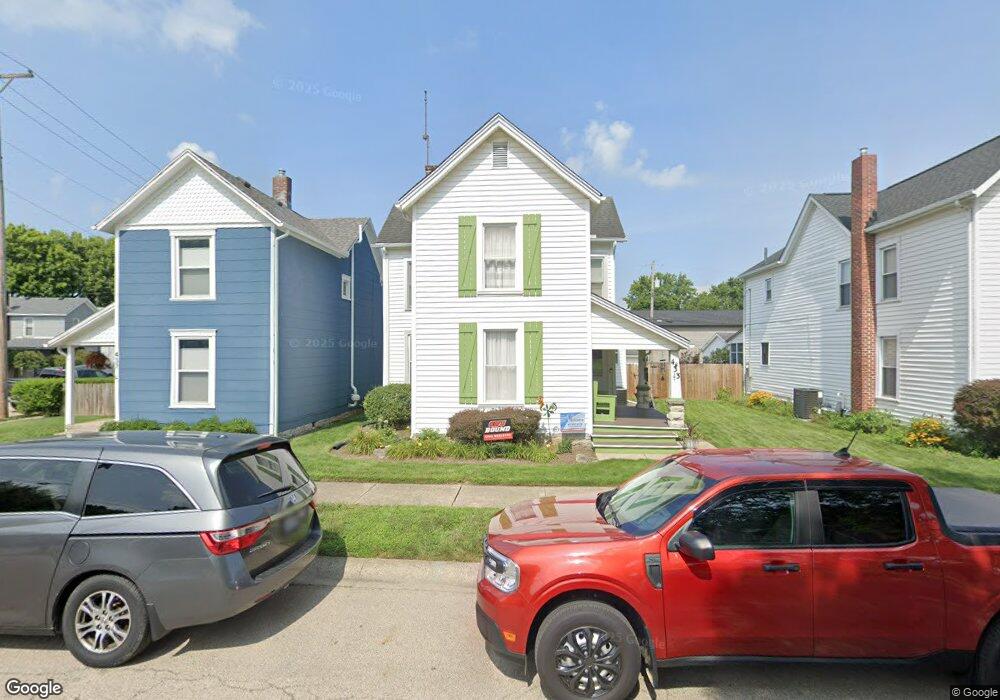
433 S 4th St Miamisburg, OH 45342
Downtown Miamisburg NeighborhoodEstimated Value: $180,000 - $203,000
3
Beds
1
Bath
1,540
Sq Ft
$124/Sq Ft
Est. Value
About This Home
This home is located at 433 S 4th St, Miamisburg, OH 45342 and is currently estimated at $190,869, approximately $123 per square foot. 433 S 4th St is a home located in Montgomery County with nearby schools including Miamisburg High School and Bethel Baptist School.
Ownership History
Date
Name
Owned For
Owner Type
Purchase Details
Closed on
Oct 31, 2002
Sold by
Hortman Douglas L and Hortman Diane
Bought by
Enneking Andrew A and Enneking Judith A
Current Estimated Value
Home Financials for this Owner
Home Financials are based on the most recent Mortgage that was taken out on this home.
Original Mortgage
$94,242
Outstanding Balance
$39,706
Interest Rate
6.1%
Mortgage Type
FHA
Estimated Equity
$151,163
Purchase Details
Closed on
Feb 1, 1994
Sold by
Hortman Donald L and Hortman Jane
Bought by
Hortman Douglas L
Create a Home Valuation Report for This Property
The Home Valuation Report is an in-depth analysis detailing your home's value as well as a comparison with similar homes in the area
Home Values in the Area
Average Home Value in this Area
Purchase History
| Date | Buyer | Sale Price | Title Company |
|---|---|---|---|
| Enneking Andrew A | $95,000 | -- | |
| Hortman Douglas L | -- | -- |
Source: Public Records
Mortgage History
| Date | Status | Borrower | Loan Amount |
|---|---|---|---|
| Open | Enneking Andrew A | $94,242 |
Source: Public Records
Tax History Compared to Growth
Tax History
| Year | Tax Paid | Tax Assessment Tax Assessment Total Assessment is a certain percentage of the fair market value that is determined by local assessors to be the total taxable value of land and additions on the property. | Land | Improvement |
|---|---|---|---|---|
| 2024 | $2,912 | $45,180 | $5,570 | $39,610 |
| 2023 | $2,912 | $45,180 | $5,570 | $39,610 |
| 2022 | $2,409 | $31,370 | $3,870 | $27,500 |
| 2021 | $2,135 | $31,370 | $3,870 | $27,500 |
| 2020 | $2,130 | $31,370 | $3,870 | $27,500 |
| 2019 | $1,915 | $25,790 | $3,870 | $21,920 |
| 2018 | $1,921 | $25,790 | $3,870 | $21,920 |
| 2017 | $1,908 | $25,790 | $3,870 | $21,920 |
| 2016 | $1,946 | $25,360 | $3,870 | $21,490 |
| 2015 | $1,947 | $25,360 | $3,870 | $21,490 |
| 2014 | $1,908 | $25,360 | $3,870 | $21,490 |
| 2012 | -- | $23,860 | $5,680 | $18,180 |
Source: Public Records
Map
Nearby Homes
- 513 Mound Ave
- 619 Jefferson St
- 235 S 7th St
- 150 S Main St
- 111 Old Main St
- 460 S 8th St
- 111 S Main St
- 42 S Main St
- 805 E Linden Ave
- 736 Park Ave
- 607 E Central Ave
- 24 S 8th St
- 740 E Central Ave
- 832 E Maple Ave
- 7 N Riverview Ave
- 265 S Riverview Ave
- 555 E Sycamore St
- 816 E Pearl St
- 319 N 1st St
- 1331 Cherry Hill Dr