Estimated Value: $347,510 - $401,000
3
Beds
1
Bath
2,106
Sq Ft
$175/Sq Ft
Est. Value
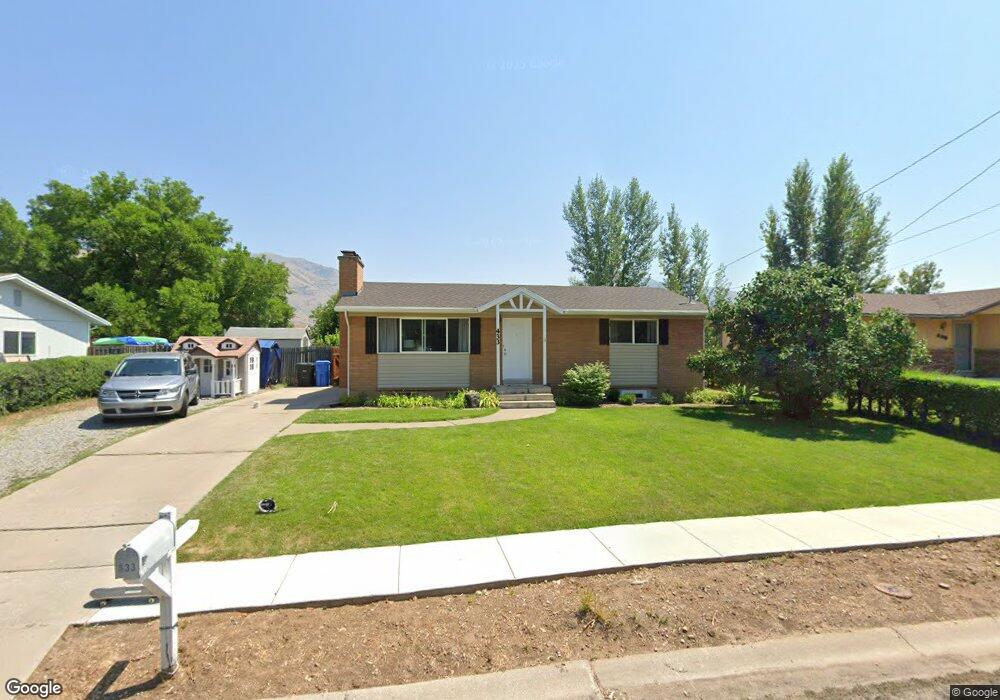
About This Home
This home is located at 433 S 600 E, Hyrum, UT 84319 and is currently estimated at $369,128, approximately $175 per square foot. 433 S 600 E is a home located in Cache County with nearby schools including Millville School, South Cache Middle School, and Mountain Crest High School.
Ownership History
Date
Name
Owned For
Owner Type
Purchase Details
Closed on
May 15, 2013
Sold by
Sackett Joshua C and Sackett Jennifer
Bought by
Digerness Jared and Digerness Melanie
Current Estimated Value
Home Financials for this Owner
Home Financials are based on the most recent Mortgage that was taken out on this home.
Original Mortgage
$113,600
Outstanding Balance
$79,858
Interest Rate
3.38%
Mortgage Type
New Conventional
Estimated Equity
$289,270
Purchase Details
Closed on
Jan 8, 2009
Sold by
Lewis Joel and Lewis Cindi
Bought by
Sackett Joshua C and Sackett Jennifer
Home Financials for this Owner
Home Financials are based on the most recent Mortgage that was taken out on this home.
Original Mortgage
$122,878
Interest Rate
5.97%
Mortgage Type
FHA
Purchase Details
Closed on
May 2, 2006
Sold by
Owen John R and Owen Jessica D
Bought by
Lewis Joel and Lewis Cindi
Home Financials for this Owner
Home Financials are based on the most recent Mortgage that was taken out on this home.
Original Mortgage
$23,800
Interest Rate
6.41%
Mortgage Type
Stand Alone Second
Create a Home Valuation Report for This Property
The Home Valuation Report is an in-depth analysis detailing your home's value as well as a comparison with similar homes in the area
Home Values in the Area
Average Home Value in this Area
Purchase History
| Date | Buyer | Sale Price | Title Company |
|---|---|---|---|
| Digerness Jared | -- | American Secure Title Logan | |
| Sackett Joshua C | -- | Cache Title Company | |
| Lewis Joel | -- | Summit Title & Escrow |
Source: Public Records
Mortgage History
| Date | Status | Borrower | Loan Amount |
|---|---|---|---|
| Open | Digerness Jared | $113,600 | |
| Previous Owner | Sackett Joshua C | $122,878 | |
| Previous Owner | Lewis Joel | $23,800 | |
| Previous Owner | Lewis Joel | $95,200 |
Source: Public Records
Tax History
| Year | Tax Paid | Tax Assessment Tax Assessment Total Assessment is a certain percentage of the fair market value that is determined by local assessors to be the total taxable value of land and additions on the property. | Land | Improvement |
|---|---|---|---|---|
| 2025 | $1,200 | $172,245 | $0 | $0 |
| 2024 | $1,278 | $171,385 | $0 | $0 |
| 2023 | $1,336 | $171,310 | $0 | $0 |
| 2022 | $1,394 | $171,305 | $0 | $0 |
| 2021 | $134 | $254,340 | $63,900 | $190,440 |
| 2020 | $1,253 | $222,600 | $63,900 | $158,700 |
| 2019 | $938 | $156,640 | $41,000 | $115,640 |
| 2018 | $861 | $139,000 | $41,000 | $98,000 |
| 2017 | $843 | $70,675 | $0 | $0 |
| 2016 | $862 | $70,675 | $0 | $0 |
| 2015 | $865 | $70,675 | $0 | $0 |
| 2014 | $840 | $70,195 | $0 | $0 |
| 2013 | -- | $70,195 | $0 | $0 |
Source: Public Records
Map
Nearby Homes
Your Personal Tour Guide
Ask me questions while you tour the home.