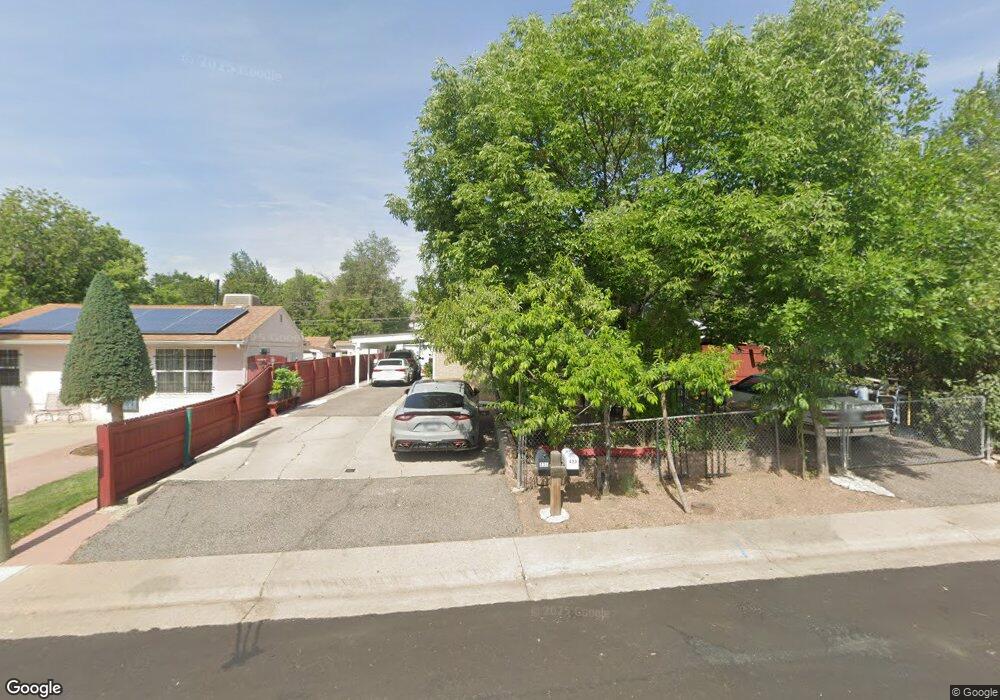
433 S Osceola St Denver, CO 80219
Westwood NeighborhoodEstimated Value: $510,000 - $573,616
4
Beds
1
Bath
1,508
Sq Ft
$359/Sq Ft
Est. Value
About This Home
This home is located at 433 S Osceola St, Denver, CO 80219 and is currently estimated at $541,808, approximately $359 per square foot. 433 S Osceola St is a home located in Denver County with nearby schools including Knapp Elementary School, Kepner Beacon Middle School, and West High School.
Ownership History
Date
Name
Owned For
Owner Type
Purchase Details
Closed on
Feb 21, 2022
Sold by
Banuelos Ramirez Fernando
Bought by
Ramirez Fernando Banuelos and Debanuelos Adela Cabral
Current Estimated Value
Purchase Details
Closed on
Aug 31, 2001
Sold by
Munoz Jesus Valdez and Pena Gomez Jaime
Bought by
Banuelos Fernando and Banuelos Adela
Home Financials for this Owner
Home Financials are based on the most recent Mortgage that was taken out on this home.
Original Mortgage
$187,064
Interest Rate
6.98%
Purchase Details
Closed on
Feb 6, 1998
Sold by
Dickens Square Ltd
Bought by
Munoz Jesus Valdez and Pena Gomez Jaime
Home Financials for this Owner
Home Financials are based on the most recent Mortgage that was taken out on this home.
Original Mortgage
$110,754
Interest Rate
7.02%
Purchase Details
Closed on
Dec 4, 1997
Sold by
Guyton John B
Bought by
Dickens Square Ltd
Create a Home Valuation Report for This Property
The Home Valuation Report is an in-depth analysis detailing your home's value as well as a comparison with similar homes in the area
Home Values in the Area
Average Home Value in this Area
Purchase History
| Date | Buyer | Sale Price | Title Company |
|---|---|---|---|
| Ramirez Fernando Banuelos | -- | None Listed On Document | |
| Banuelos Fernando | $190,000 | Land Title Guarantee Company | |
| Munoz Jesus Valdez | $112,000 | Land Title | |
| Dickens Square Ltd | $101,000 | First American Heritage Titl |
Source: Public Records
Mortgage History
| Date | Status | Borrower | Loan Amount |
|---|---|---|---|
| Previous Owner | Banuelos Fernando | $187,064 | |
| Previous Owner | Munoz Jesus Valdez | $110,754 | |
| Closed | Munoz Jesus Valdez | $3,100 |
Source: Public Records
Tax History Compared to Growth
Tax History
| Year | Tax Paid | Tax Assessment Tax Assessment Total Assessment is a certain percentage of the fair market value that is determined by local assessors to be the total taxable value of land and additions on the property. | Land | Improvement |
|---|---|---|---|---|
| 2024 | $2,844 | $35,910 | $7,630 | $28,280 |
| 2023 | $2,783 | $35,910 | $7,630 | $28,280 |
| 2022 | $2,133 | $26,820 | $9,190 | $17,630 |
| 2021 | $2,104 | $28,200 | $9,660 | $18,540 |
| 2020 | $1,833 | $24,710 | $5,800 | $18,910 |
| 2019 | $1,782 | $24,710 | $5,800 | $18,910 |
| 2018 | $1,487 | $19,220 | $5,840 | $13,380 |
| 2017 | $1,483 | $19,220 | $5,840 | $13,380 |
| 2016 | $1,203 | $14,750 | $5,381 | $9,369 |
| 2015 | $1,152 | $14,750 | $5,381 | $9,369 |
| 2014 | $938 | $11,290 | $2,690 | $8,600 |
Source: Public Records
Map
Nearby Homes
- 512 S Perry St
- 3854 W Nevada Place
- 370 S Newton St
- 372 S Newton St
- 367 S Quitman St
- 580 S Quitman St
- 538 S Osceola St
- 461 S Lowell Blvd
- 4190 W Alameda Ave
- 549 S Raleigh St
- 352 S Stuart St
- 4200 W Alameda Ave
- 274 S Meade St
- 655 S Perry St
- 4332 W Nevada Place
- 3570 W Center Ave
- 220 S Raleigh St
- 4418 W Nevada Place
- 656 S Stuart St
- 3520 W Center Ave
- 441 S Osceola St
- 447 S Osceola St
- 409 S Osceola St
- 445 S Osceola St
- 440 S Perry St
- 450 S Perry St
- 470 S Perry St
- 428 S Perry St
- 428 S Perry St
- 440 S Osceola St
- 449 S Osceola St
- 436 S Osceola St
- 418 S Perry St
- 472 S Perry St
- 426 S Osceola St
- 401 S Osceola St
- 438 S Osceola St
- 442 S Osceola St
- 499 S Osceola St
- 476 S Perry St