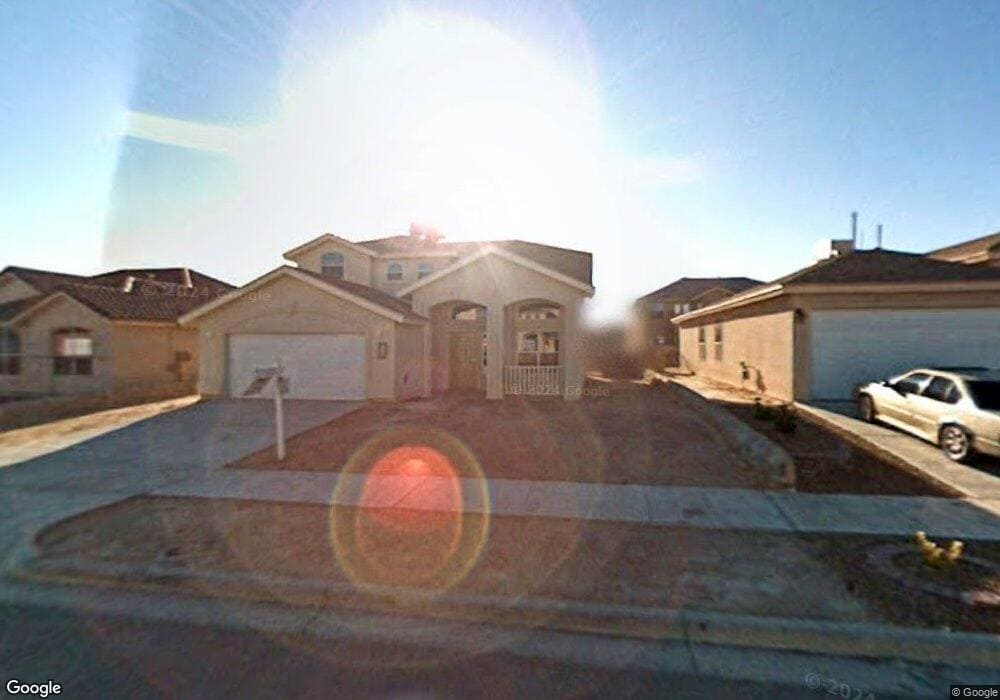
433 Sand Verbena St Unit 14 El Paso, TX 79928
Estimated Value: $279,409 - $306,000
4
Beds
4
Baths
2,159
Sq Ft
$135/Sq Ft
Est. Value
About This Home
This home is located at 433 Sand Verbena St Unit 14, El Paso, TX 79928 and is currently estimated at $290,852, approximately $134 per square foot. 433 Sand Verbena St Unit 14 is a home located in El Paso County with nearby schools including Desert Hills Elementary School, Horizon Middle School, and Horizon High School.
Ownership History
Date
Name
Owned For
Owner Type
Purchase Details
Closed on
Jun 29, 2018
Sold by
El Trio Lp
Bought by
Robles Juan Francisco and Robles Sofia Loren
Current Estimated Value
Home Financials for this Owner
Home Financials are based on the most recent Mortgage that was taken out on this home.
Original Mortgage
$6,282
Outstanding Balance
$5,456
Interest Rate
4.6%
Mortgage Type
Purchase Money Mortgage
Estimated Equity
$285,396
Purchase Details
Closed on
Mar 2, 2010
Sold by
Fuentes Jose R and Fuentes Blanca
Bought by
El Trio Lp
Purchase Details
Closed on
Aug 15, 2008
Sold by
Carefree Homes Ii Lp
Bought by
Fuentes Jose R
Home Financials for this Owner
Home Financials are based on the most recent Mortgage that was taken out on this home.
Original Mortgage
$127,160
Interest Rate
6.29%
Mortgage Type
Purchase Money Mortgage
Create a Home Valuation Report for This Property
The Home Valuation Report is an in-depth analysis detailing your home's value as well as a comparison with similar homes in the area
Home Values in the Area
Average Home Value in this Area
Purchase History
| Date | Buyer | Sale Price | Title Company |
|---|---|---|---|
| Robles Juan Francisco | -- | None Available | |
| El Trio Lp | $130,000 | None Available | |
| Fuentes Jose R | -- | None Available |
Source: Public Records
Mortgage History
| Date | Status | Borrower | Loan Amount |
|---|---|---|---|
| Open | Robles Juan Francisco | $6,282 | |
| Previous Owner | Fuentes Jose R | $127,160 |
Source: Public Records
Tax History Compared to Growth
Tax History
| Year | Tax Paid | Tax Assessment Tax Assessment Total Assessment is a certain percentage of the fair market value that is determined by local assessors to be the total taxable value of land and additions on the property. | Land | Improvement |
|---|---|---|---|---|
| 2025 | $6,464 | $261,064 | -- | -- |
| 2024 | $6,464 | $237,331 | -- | -- |
| 2023 | $5,662 | $215,755 | $0 | $0 |
| 2022 | $6,360 | $196,141 | $0 | $0 |
| 2021 | $6,363 | $208,396 | $27,578 | $180,818 |
| 2020 | $5,631 | $162,100 | $27,578 | $134,522 |
| 2018 | $5,274 | $157,136 | $27,578 | $129,558 |
| 2017 | $4,951 | $149,112 | $27,578 | $121,534 |
| 2016 | $4,951 | $149,112 | $27,578 | $121,534 |
| 2015 | $4,728 | $149,112 | $27,578 | $121,534 |
| 2014 | $4,728 | $149,657 | $27,578 | $122,079 |
Source: Public Records
Map
Nearby Homes
- 444 Ghost Flower St
- 14117 Highweed Dr
- 14100 Ghost Flower St
- 441 Desert Dandelion St
- 409 Desert Chicory St
- 14052 Highweed Dr
- 475 N Kenazo Ave
- 467 N Kenazo Ave
- 487 N Kenazo Ave
- 14032 Highweed Dr
- 479 N Kenazo Ave
- 469 N Kenazo Ave
- 400 Mura Place
- 14156 Warren Belin Dr
- 317 Jim Knowles Place
- 394 Brill Cir
- 0 Highweed Dr Unit 918787
- 390 Medill Place
- PN-31080 Tbd
- TBD Rodman St
- 433 Sand Verbena St
- 437 Sand Verbena St
- 429 Sand Verbena St
- 432 Ghost Flower St
- 432 Ghost Flower St
- 441 Sand Verbena St
- 441 Sand Verbena St Unit 1
- 441 Sand Verbena St
- 436 Ghost Flower St
- 428 Ghost Flower St
- 425 Sand Verbena St
- 440 Ghost Flower St
- 424 Ghost Flower St
- 432 Sand Verbena St
- 445 Sand Verbena St
- 428 Sand Verbena St
- 436 Sand Verbena St
- 421 Sand Verbena St
- 424 Sand Verbena St
- 440 Sand Verbena St