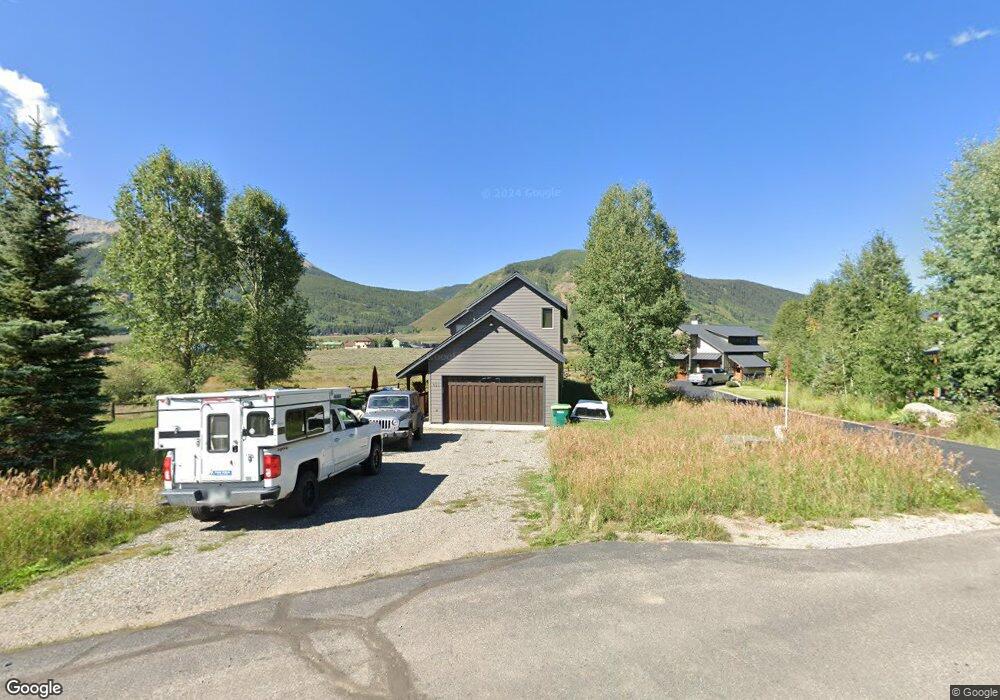
433 Slate River Dr Unit Lot 9 Crested Butte, CO 81224
Estimated Value: $1,484,000 - $1,741,902
3
Beds
2
Baths
1,712
Sq Ft
$920/Sq Ft
Est. Value
About This Home
This home is located at 433 Slate River Dr Unit Lot 9, Crested Butte, CO 81224 and is currently estimated at $1,575,226, approximately $920 per square foot. 433 Slate River Dr Unit Lot 9 is a home located in Gunnison County with nearby schools including Gunnison Elementary School, Crested Butte Community School, and Gunnison Middle School.
Ownership History
Date
Name
Owned For
Owner Type
Purchase Details
Closed on
Nov 10, 2017
Sold by
Claflin Blake L and Giles Jaima C
Bought by
Claflin Blake L
Current Estimated Value
Purchase Details
Closed on
May 25, 2013
Sold by
Mcvay Michael R and Mcvay Mary M
Bought by
Claflin Blake L and Giles Jaima C
Home Financials for this Owner
Home Financials are based on the most recent Mortgage that was taken out on this home.
Original Mortgage
$360,000
Outstanding Balance
$253,950
Interest Rate
3.38%
Mortgage Type
New Conventional
Estimated Equity
$1,321,276
Purchase Details
Closed on
Mar 29, 2005
Sold by
Lucas Lucille C
Bought by
Mcvay Michael R and Mcvay Mary M
Purchase Details
Closed on
Sep 15, 1999
Sold by
Huffstetler Roy
Bought by
Lucas Lucille C
Purchase Details
Closed on
Jan 20, 1994
Purchase Details
Closed on
Sep 9, 1993
Create a Home Valuation Report for This Property
The Home Valuation Report is an in-depth analysis detailing your home's value as well as a comparison with similar homes in the area
Home Values in the Area
Average Home Value in this Area
Purchase History
| Date | Buyer | Sale Price | Title Company |
|---|---|---|---|
| Claflin Blake L | -- | None Available | |
| Claflin Blake L | $450,000 | None Available | |
| Mcvay Michael R | $550,000 | None Available | |
| Lucas Lucille C | $415,000 | -- | |
| -- | $62,100 | -- | |
| -- | $46,000 | -- |
Source: Public Records
Mortgage History
| Date | Status | Borrower | Loan Amount |
|---|---|---|---|
| Open | Claflin Blake L | $360,000 |
Source: Public Records
Tax History Compared to Growth
Tax History
| Year | Tax Paid | Tax Assessment Tax Assessment Total Assessment is a certain percentage of the fair market value that is determined by local assessors to be the total taxable value of land and additions on the property. | Land | Improvement |
|---|---|---|---|---|
| 2024 | $5,493 | $92,710 | $19,690 | $73,020 |
| 2023 | $5,493 | $89,030 | $18,910 | $70,120 |
| 2022 | $4,896 | $70,090 | $12,420 | $57,670 |
| 2021 | $4,360 | $72,110 | $12,780 | $59,330 |
| 2020 | $2,498 | $41,750 | $10,440 | $31,310 |
| 2019 | $2,449 | $41,750 | $10,440 | $31,310 |
| 2018 | $2,192 | $35,780 | $8,080 | $27,700 |
| 2015 | $945 | $33,010 | $7,910 | $25,100 |
| 2014 | $945 | $31,150 | $13,350 | $17,800 |
Source: Public Records
Map
Nearby Homes
- 491 Slate River Dr
- 180 Elk Valley Rd Unit 124
- 180 Elk Valley Rd Unit 109
- 180 Elk Valley Rd Unit 110
- 180 Elk Valley Rd Unit 102
- 180 Elk Valley Rd Unit 118
- 1294 County Road 734
- 180 Elk Valley Rd Unit 112
- 180 Elk Valley Rd Unit 114
- 1250 County Road 734
- 45 Creek Cove
- 2890 Trappers Way
- 168 W Silver Sage Dr
- 402 Eagle Ln
- 179 Aspen Ln
- 166 & 168 Coyote Cir
- 253 W Silver Sage Dr
- 434 Country Club Dr
- 350 Country Club Dr Unit 217A
- 350 Country Club Dr Unit 218A
- 433 Slate River Dr
- 441 Slate River Dr
- 438 Slate River Dr
- 455 Slate River Dr
- 466 Slate River Dr
- 469 Slate River Dr
- 420 Slate River Dr
- 420 Slate River Dr Unit Lot 8
- 496 Slate River Dr
- 495 Slate River Dr
- 411 Slate River Dr
- 505 Slate River Dr
- 524 Slate River Dr
- 537 Slate River Dr
- 528 Slate River Dr
- 0 Slate River Dr Unit 766097
- 0 Slate River Dr Unit 770129
- 0 Slate River Dr Unit 5 761137
- 0 Slate River Dr Unit 2 759880
- 0 Slate River Dr Unit 9 757132