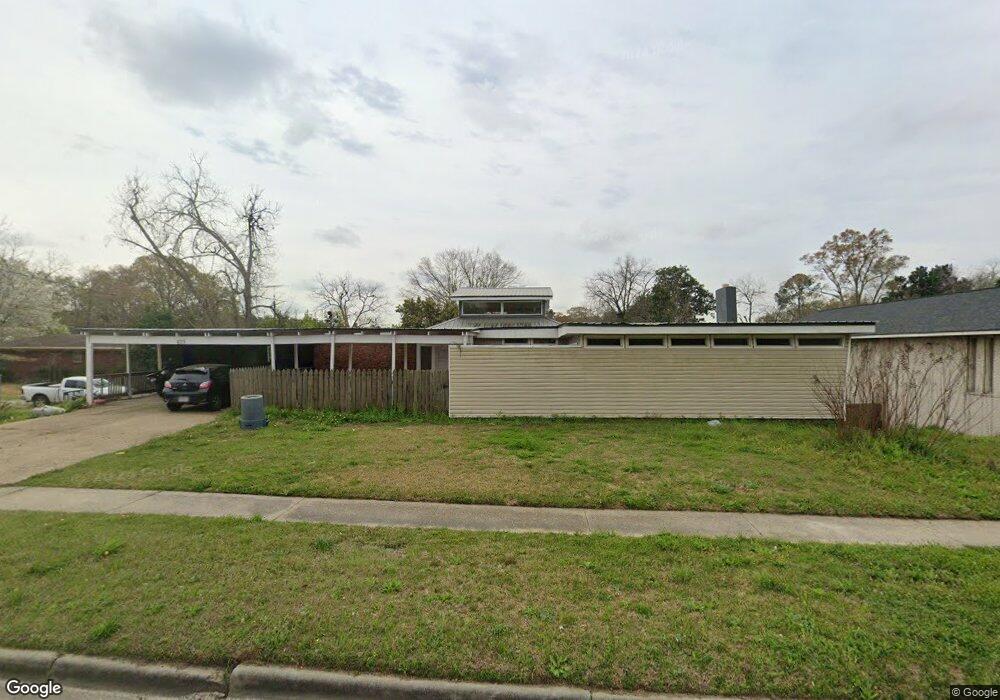
433 SW Broad St Metter, GA 30439
Estimated Value: $218,000 - $368,000
3
Beds
4
Baths
3,769
Sq Ft
$76/Sq Ft
Est. Value
About This Home
This home is located at 433 SW Broad St, Metter, GA 30439 and is currently estimated at $287,237, approximately $76 per square foot. 433 SW Broad St is a home located in Candler County with nearby schools including Metter Elementary School, Metter Intermediate School, and Metter Middle School.
Ownership History
Date
Name
Owned For
Owner Type
Purchase Details
Closed on
Jan 18, 2021
Sold by
Durden Banking Co Inc
Bought by
Lee Wesley J
Current Estimated Value
Purchase Details
Closed on
Nov 3, 2020
Sold by
Beasley Jason
Bought by
Durden Banking Co Inc
Purchase Details
Closed on
Jun 30, 2008
Sold by
Sea Island Bank
Bought by
Beasley Jason
Purchase Details
Closed on
Apr 16, 2008
Sold by
Riddick Robert S
Bought by
Sea Island Bank
Purchase Details
Closed on
Mar 1, 2005
Sold by
Bryd Larry D
Bought by
Riddick Robert C and Riddick Catherine C
Home Financials for this Owner
Home Financials are based on the most recent Mortgage that was taken out on this home.
Original Mortgage
$161,530
Interest Rate
5.6%
Mortgage Type
Cash
Purchase Details
Closed on
Sep 29, 2000
Sold by
Taylor Betty H
Bought by
Byrd Larry D
Purchase Details
Closed on
Apr 30, 1999
Sold by
Bird Vicki T
Bought by
Taylor Betty H
Purchase Details
Closed on
Jun 1, 1985
Sold by
Taylor Steve
Bought by
Taylor Betty H
Create a Home Valuation Report for This Property
The Home Valuation Report is an in-depth analysis detailing your home's value as well as a comparison with similar homes in the area
Home Values in the Area
Average Home Value in this Area
Purchase History
| Date | Buyer | Sale Price | Title Company |
|---|---|---|---|
| Lee Wesley J | $80,000 | -- | |
| Durden Banking Co Inc | -- | -- | |
| Beasley Jason | $117,000 | -- | |
| Sea Island Bank | -- | -- | |
| Riddick Robert C | $168,000 | -- | |
| Byrd Larry D | $128,800 | -- | |
| Taylor Betty H | -- | -- | |
| Taylor Betty H | -- | -- |
Source: Public Records
Mortgage History
| Date | Status | Borrower | Loan Amount |
|---|---|---|---|
| Previous Owner | Riddick Robert C | $161,530 |
Source: Public Records
Tax History Compared to Growth
Tax History
| Year | Tax Paid | Tax Assessment Tax Assessment Total Assessment is a certain percentage of the fair market value that is determined by local assessors to be the total taxable value of land and additions on the property. | Land | Improvement |
|---|---|---|---|---|
| 2024 | $3,940 | $90,601 | $7,360 | $83,241 |
| 2023 | $3,717 | $87,970 | $7,360 | $80,610 |
| 2022 | $1,412 | $71,216 | $7,360 | $63,856 |
| 2021 | $2,691 | $63,824 | $7,360 | $56,464 |
| 2020 | $2,697 | $63,824 | $7,360 | $56,464 |
| 2019 | $2,649 | $62,065 | $7,360 | $54,705 |
| 2018 | $2,460 | $61,750 | $7,360 | $54,390 |
| 2017 | $2,068 | $61,750 | $7,360 | $54,390 |
| 2016 | $2,358 | $61,750 | $7,360 | $54,390 |
| 2015 | $1,949 | $62,904 | $7,360 | $55,545 |
| 2014 | $1,949 | $62,905 | $7,360 | $55,545 |
Source: Public Records
Map
Nearby Homes
- 221 S College St
- 250 S Lewis St
- 405 Preston St
- 360 S Kennedy St
- 295 S Lewis St
- 430 Preston St
- 40 Hickory St
- 450 S Rountree St
- 365 S Leroy St
- 405 S Leroy St
- 550 S Rountree St
- 465 Cedar St
- 822 N Lewis St
- 0 Central Ave Unit 10628403
- 170 Foxridge Ct
- 160 Foxridge Ct
- 190 Foxridge Ct
- 150 W Willow Lake Dr
- 0 Hulsey Dr
- 0 Hulsey Dr Unit 10656930
- 40 S Williams St
- 50 S Williams St
- 441 SW Broad St
- 60 S Williams St Unit 1
- 60 S Williams St
- 321 SW Broad St
- 455 SW Broad St
- 43 S Williams St
- 33 S Williams St
- 0 S Williams St Unit 20085749
- 0 S Williams St Unit 8215137
- 53 S Williams St
- 440 W Vertia St
- 319 SW Broad St
- 457 SW Broad St
- 80 S Williams St
- 460 SW Broad St
- 328 SW Broad St
- 5 N Williams St
- 311 SW Broad St