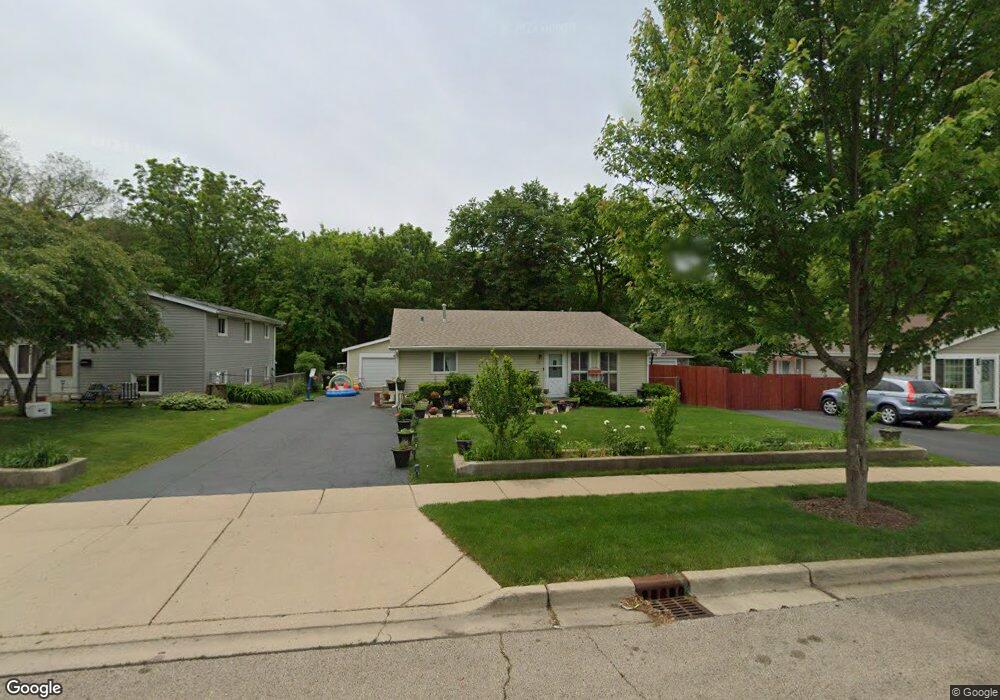
433 Tulsa Ave Carpentersville, IL 60110
Estimated Value: $265,181 - $287,000
3
Beds
--
Bath
1,628
Sq Ft
$171/Sq Ft
Est. Value
About This Home
This home is located at 433 Tulsa Ave, Carpentersville, IL 60110 and is currently estimated at $278,545, approximately $171 per square foot. 433 Tulsa Ave is a home located in Kane County with nearby schools including Lakewood School, Crescent City Grade School, and Carpentersville Middle School.
Ownership History
Date
Name
Owned For
Owner Type
Purchase Details
Closed on
Dec 22, 2005
Sold by
Maldonado Rosalio
Bought by
Maldonado Eloy and Maldonado Maria
Current Estimated Value
Purchase Details
Closed on
Sep 18, 2002
Sold by
Harris Trust & Svgs Bank
Bought by
Maldonado Rosalio
Home Financials for this Owner
Home Financials are based on the most recent Mortgage that was taken out on this home.
Original Mortgage
$60,000
Interest Rate
6.29%
Create a Home Valuation Report for This Property
The Home Valuation Report is an in-depth analysis detailing your home's value as well as a comparison with similar homes in the area
Home Values in the Area
Average Home Value in this Area
Purchase History
| Date | Buyer | Sale Price | Title Company |
|---|---|---|---|
| Maldonado Eloy | -- | -- | |
| Maldonado Rosalio | $107,000 | Chicago Title Insurance Co |
Source: Public Records
Mortgage History
| Date | Status | Borrower | Loan Amount |
|---|---|---|---|
| Closed | Maldonado Rosalio | $60,000 |
Source: Public Records
Tax History Compared to Growth
Tax History
| Year | Tax Paid | Tax Assessment Tax Assessment Total Assessment is a certain percentage of the fair market value that is determined by local assessors to be the total taxable value of land and additions on the property. | Land | Improvement |
|---|---|---|---|---|
| 2024 | $5,570 | $73,543 | $12,553 | $60,990 |
| 2023 | $5,560 | $66,172 | $11,295 | $54,877 |
| 2022 | $5,318 | $61,068 | $11,295 | $49,773 |
| 2021 | $5,223 | $57,661 | $10,665 | $46,996 |
| 2020 | $5,149 | $56,364 | $10,425 | $45,939 |
| 2019 | $5,063 | $53,507 | $9,897 | $43,610 |
| 2018 | $4,798 | $48,343 | $9,701 | $38,642 |
| 2017 | $4,639 | $45,223 | $9,075 | $36,148 |
| 2016 | $4,354 | $39,573 | $8,787 | $30,786 |
| 2015 | -- | $32,681 | $8,234 | $24,447 |
| 2014 | -- | $29,232 | $8,007 | $21,225 |
| 2013 | -- | $30,127 | $8,252 | $21,875 |
Source: Public Records
Map
Nearby Homes