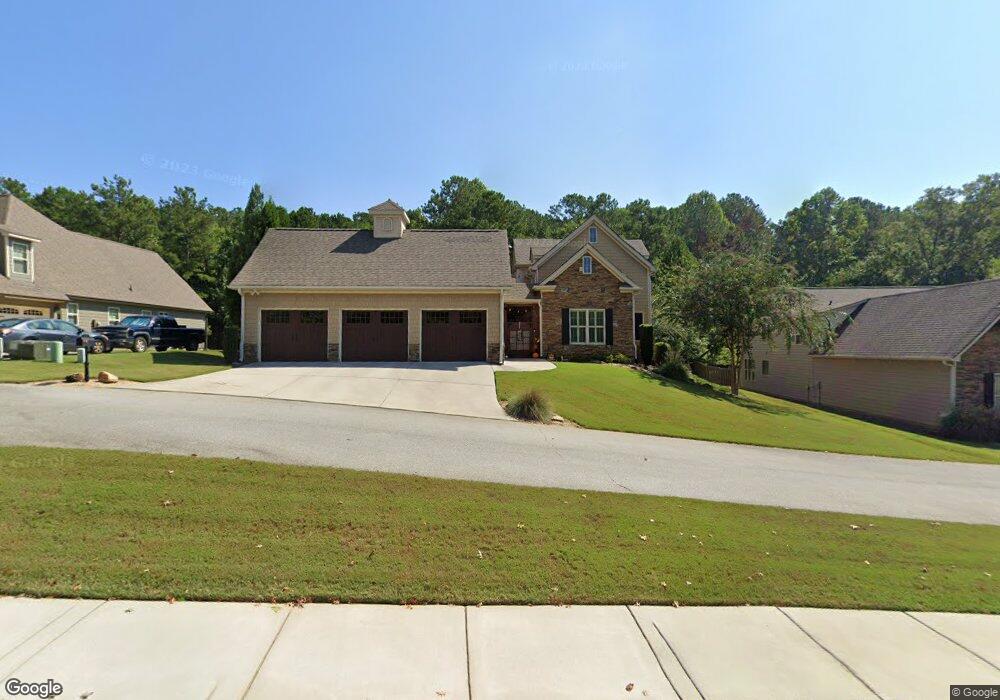
433 Vanderbilt Pkwy Newnan, GA 30265
Estimated Value: $591,000 - $829,000
4
Beds
4
Baths
2,771
Sq Ft
$243/Sq Ft
Est. Value
About This Home
This home is located at 433 Vanderbilt Pkwy, Newnan, GA 30265 and is currently estimated at $674,288, approximately $243 per square foot. 433 Vanderbilt Pkwy is a home located in Coweta County with nearby schools including Welch Elementary School, Lee Middle School, and East Coweta High School.
Ownership History
Date
Name
Owned For
Owner Type
Purchase Details
Closed on
Jun 6, 2016
Sold by
James S Watts
Bought by
Jackson Darryl and Jackson Lisa
Current Estimated Value
Home Financials for this Owner
Home Financials are based on the most recent Mortgage that was taken out on this home.
Original Mortgage
$375,250
Outstanding Balance
$298,725
Interest Rate
3.66%
Estimated Equity
$375,563
Purchase Details
Closed on
May 5, 2014
Sold by
David Lindsey Homes Inc
Bought by
Watts James S and Watts Martha P
Purchase Details
Closed on
Nov 5, 2013
Sold by
Olmsted Llc
Bought by
David Lindsey Homes Inc
Home Financials for this Owner
Home Financials are based on the most recent Mortgage that was taken out on this home.
Original Mortgage
$225,000
Interest Rate
4.26%
Mortgage Type
New Conventional
Purchase Details
Closed on
May 22, 2002
Sold by
Roquemore William A
Bought by
Olmsted Llc
Create a Home Valuation Report for This Property
The Home Valuation Report is an in-depth analysis detailing your home's value as well as a comparison with similar homes in the area
Home Values in the Area
Average Home Value in this Area
Purchase History
| Date | Buyer | Sale Price | Title Company |
|---|---|---|---|
| Jackson Darryl | -- | -- | |
| Watts James S | $325,400 | -- | |
| David Lindsey Homes Inc | $60,000 | -- | |
| Olmsted Llc | $9,000 | -- |
Source: Public Records
Mortgage History
| Date | Status | Borrower | Loan Amount |
|---|---|---|---|
| Open | Jackson Darryl | $375,250 | |
| Closed | Jackson Darryl | -- | |
| Previous Owner | David Lindsey Homes Inc | $225,000 |
Source: Public Records
Tax History Compared to Growth
Tax History
| Year | Tax Paid | Tax Assessment Tax Assessment Total Assessment is a certain percentage of the fair market value that is determined by local assessors to be the total taxable value of land and additions on the property. | Land | Improvement |
|---|---|---|---|---|
| 2025 | $4,746 | $242,622 | $36,000 | $206,622 |
| 2024 | $4,263 | $229,064 | $29,000 | $200,064 |
| 2023 | $4,263 | $192,364 | $29,000 | $163,364 |
| 2022 | $4,355 | $182,475 | $29,000 | $153,475 |
| 2021 | $4,333 | $164,787 | $29,000 | $135,787 |
| 2020 | $4,429 | $164,787 | $29,000 | $135,787 |
| 2019 | $3,736 | $128,080 | $26,000 | $102,080 |
| 2018 | $3,757 | $128,080 | $26,000 | $102,080 |
| 2017 | $3,740 | $128,080 | $26,000 | $102,080 |
| 2016 | $2,955 | $125,303 | $26,000 | $99,303 |
| 2015 | $2,581 | $112,890 | $26,000 | $86,890 |
| 2014 | $651 | $19,500 | $19,500 | $0 |
Source: Public Records
Map
Nearby Homes
- 415 Vanderbilt Pkwy
- 18 Berkeley Park
- 460 Vanderbilt Pkwy
- 49 Leverett Dr
- 10 Fenway Ct
- 147 Lake Cove Approach
- 161 Lake Shore Dr
- 0 Mary Freeman Rd Unit 20069973
- 14 Avondale Cir
- 185 Lake Shore Dr
- 28 Fox Ridge Dr
- 37 Fox Ridge Dr
- 306 Freeman Forest Dr
- 53 Fox Ridge Dr
- 43 Beacon Crest
- 64 Gables Way
- 161 Briandwood Dr
- 15 Oak Shores Dr
- 30 Oak Shores Dr
- 100 Arbor Way
- 439 Vanderbilt Pkwy
- 427 Vanderbilt Pkwy
- 2 Berkeley Park
- 430 430 Vanderbilt Pkwy Unit 8
- 421 Vanderbilt Pkwy
- 6 Berkeley Park
- 6 Berkeley Park Unit 2
- 0 Berkeley Park Dr SE Unit LOT 11 3108803
- 0 Berkeley Park Dr SE Unit LOT 8 3108789
- 0 Berkeley Park Dr SE Unit 6 7235878
- 0 Berkeley Park Dr SE Unit 1 7219650
- 0 Berkeley Park Dr SE Unit LOT 3 3275068
- 438 Vanderbilt Pkwy Unit Lot 10
- 438 Vanderbilt Pkwy
- 0 Berkeley Park Unit 10 7394663
- 0 Berkeley Park Unit 7 7474605
- 434 Vanderbilt Pkwy
- 10 Berkeley Park
- 415 Vanderbilt Pkwy Unit 11
- 430 Vanderbilt Pkwy Unit 8