Estimated Value: $655,815 - $945,000
4
Beds
3
Baths
2,495
Sq Ft
$314/Sq Ft
Est. Value
About This Home
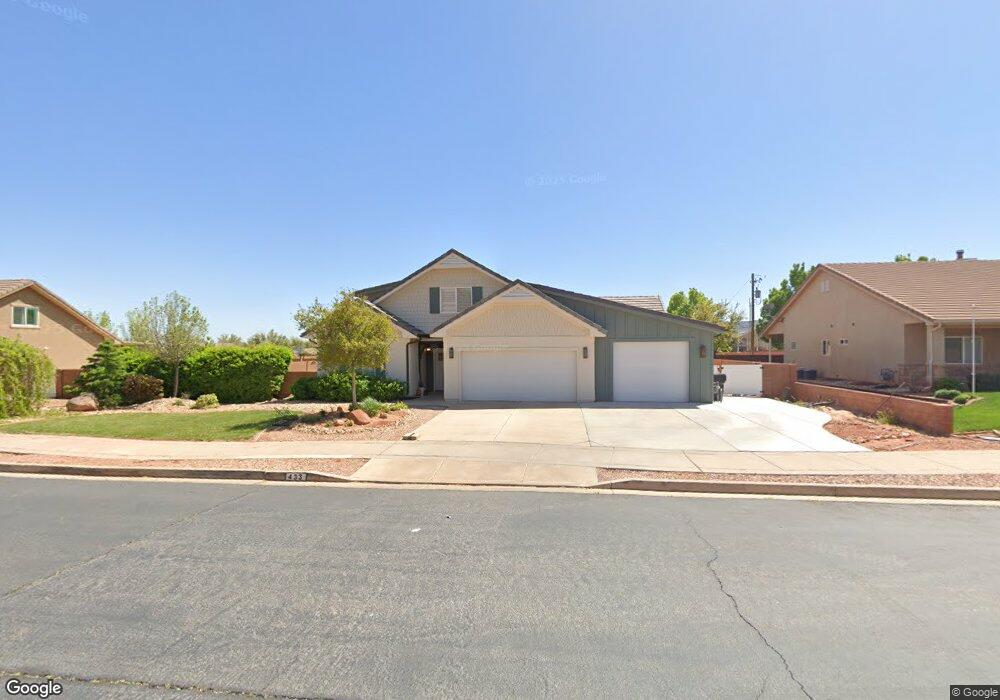
This home is located at 433 W 200 S, Ivins, UT 84738 and is currently estimated at $783,954, approximately $314 per square foot. 433 W 200 S is a home located in Washington County with nearby schools including Snow Canyon Middle School, Lava Ridge Intermediate School, and Snow Canyon High School.
Ownership History
Date
Name
Owned For
Owner Type
Purchase Details
Closed on
Jan 19, 2021
Sold by
Thompson Brett B
Bought by
Thompson Brett Benjamin
Current Estimated Value
Home Financials for this Owner
Home Financials are based on the most recent Mortgage that was taken out on this home.
Original Mortgage
$501,000
Outstanding Balance
$447,144
Interest Rate
2.71%
Mortgage Type
Construction
Estimated Equity
$336,810
Purchase Details
Closed on
Aug 19, 2011
Sold by
Color Country Community Housing Inc
Bought by
Thompson Brett B
Home Financials for this Owner
Home Financials are based on the most recent Mortgage that was taken out on this home.
Original Mortgage
$149,435
Interest Rate
4.53%
Mortgage Type
Seller Take Back
Purchase Details
Closed on
Mar 2, 2011
Sold by
Douglas Youngberg Investments Inc
Bought by
Jdl Investments Inc
Create a Home Valuation Report for This Property
The Home Valuation Report is an in-depth analysis detailing your home's value as well as a comparison with similar homes in the area
Home Values in the Area
Average Home Value in this Area
Purchase History
| Date | Buyer | Sale Price | Title Company |
|---|---|---|---|
| Thompson Brett Benjamin | -- | Inwest Title Svcs St George | |
| Thompson Brett B | -- | First Amer St George Main | |
| Color Country Community Housing Inc | -- | First Amer St George Main | |
| Jdl Investments Inc | -- | None Available |
Source: Public Records
Mortgage History
| Date | Status | Borrower | Loan Amount |
|---|---|---|---|
| Open | Thompson Brett Benjamin | $501,000 | |
| Closed | Color Country Community Housing Inc | $149,435 | |
| Closed | Thompson Brett B | $193,000 |
Source: Public Records
Tax History Compared to Growth
Tax History
| Year | Tax Paid | Tax Assessment Tax Assessment Total Assessment is a certain percentage of the fair market value that is determined by local assessors to be the total taxable value of land and additions on the property. | Land | Improvement |
|---|---|---|---|---|
| 2025 | $1,961 | $300,575 | $68,750 | $231,825 |
| 2023 | $2,050 | $300,355 | $52,250 | $248,105 |
| 2022 | $2,137 | $294,745 | $52,250 | $242,495 |
| 2021 | $1,395 | $285,900 | $65,000 | $220,900 |
| 2020 | $1,215 | $235,600 | $60,000 | $175,600 |
| 2019 | $1,279 | $242,600 | $55,000 | $187,600 |
| 2018 | $1,222 | $119,240 | $0 | $0 |
| 2017 | $1,163 | $110,385 | $0 | $0 |
| 2016 | $1,145 | $100,430 | $0 | $0 |
| 2015 | $1,179 | $99,495 | $0 | $0 |
| 2014 | $1,153 | $97,845 | $0 | $0 |
Source: Public Records
Map
Nearby Homes