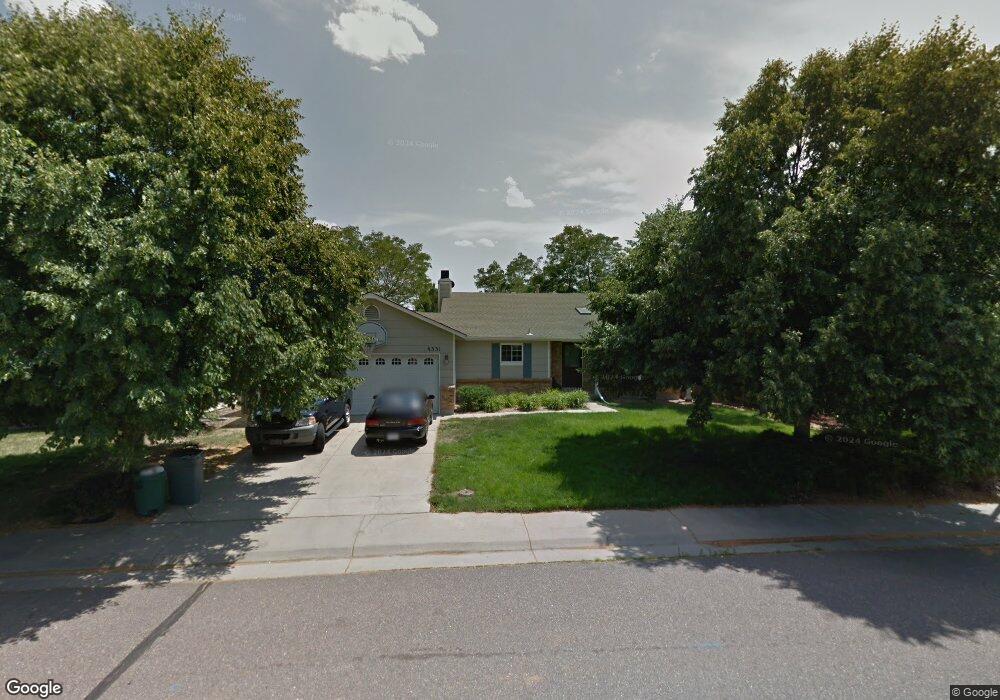
4331 S Ceylon Way Aurora, CO 80015
Prides Crossing NeighborhoodEstimated Value: $462,000 - $570,000
4
Beds
3
Baths
1,678
Sq Ft
$296/Sq Ft
Est. Value
About This Home
This home is located at 4331 S Ceylon Way, Aurora, CO 80015 and is currently estimated at $497,494, approximately $296 per square foot. 4331 S Ceylon Way is a home located in Arapahoe County with nearby schools including Summit Elementary School, Horizon Middle School, and Smoky Hill High School.
Ownership History
Date
Name
Owned For
Owner Type
Purchase Details
Closed on
Jan 21, 2015
Sold by
Mahnke Verna M
Bought by
Sager Cynthia
Current Estimated Value
Home Financials for this Owner
Home Financials are based on the most recent Mortgage that was taken out on this home.
Original Mortgage
$235,600
Outstanding Balance
$179,753
Interest Rate
3.97%
Mortgage Type
New Conventional
Estimated Equity
$317,741
Purchase Details
Closed on
Jul 29, 1994
Sold by
Burt Brian F and Burt Shari L
Bought by
Mahnke Verna M
Home Financials for this Owner
Home Financials are based on the most recent Mortgage that was taken out on this home.
Original Mortgage
$101,550
Interest Rate
8.45%
Purchase Details
Closed on
Mar 31, 1992
Sold by
Conversion Arapco
Bought by
Burt Brian F Burt Shari L
Purchase Details
Closed on
Feb 1, 1982
Sold by
Conversion Arapco
Bought by
Conversion Arapco
Purchase Details
Closed on
Jul 4, 1776
Bought by
Conversion Arapco
Create a Home Valuation Report for This Property
The Home Valuation Report is an in-depth analysis detailing your home's value as well as a comparison with similar homes in the area
Home Values in the Area
Average Home Value in this Area
Purchase History
| Date | Buyer | Sale Price | Title Company |
|---|---|---|---|
| Sager Cynthia | $248,000 | Nancy Kapica | |
| Mahnke Verna M | $119,500 | Stewart Title | |
| Burt Brian F Burt Shari L | -- | -- | |
| Conversion Arapco | -- | -- | |
| Conversion Arapco | -- | -- |
Source: Public Records
Mortgage History
| Date | Status | Borrower | Loan Amount |
|---|---|---|---|
| Open | Sager Cynthia | $235,600 | |
| Previous Owner | Mahnke Verna M | $101,550 |
Source: Public Records
Tax History
| Year | Tax Paid | Tax Assessment Tax Assessment Total Assessment is a certain percentage of the fair market value that is determined by local assessors to be the total taxable value of land and additions on the property. | Land | Improvement |
|---|---|---|---|---|
| 2025 | $2,549 | $32,688 | -- | -- |
| 2024 | $2,247 | $32,482 | -- | -- |
| 2023 | $2,247 | $32,482 | $0 | $0 |
| 2022 | $1,924 | $26,563 | $0 | $0 |
| 2021 | $1,936 | $26,563 | $0 | $0 |
| 2020 | $1,852 | $25,791 | $0 | $0 |
| 2019 | $1,787 | $25,791 | $0 | $0 |
| 2018 | $1,518 | $20,585 | $0 | $0 |
| 2017 | $1,496 | $20,585 | $0 | $0 |
| 2016 | $1,337 | $17,249 | $0 | $0 |
| 2015 | $685 | $17,249 | $0 | $0 |
| 2014 | $537 | $12,895 | $0 | $0 |
| 2013 | -- | $14,350 | $0 | $0 |
Source: Public Records
Map
Nearby Homes
- 4372 S Ceylon Way
- 4218 S Cathay Way
- 19166 E Oberlin Dr
- 4152 S Dunkirk Way
- 4460 S Ensenada St
- 19554 E Princeton Place
- 19515 E Sunset Cir
- 19208 E Stanford Dr
- 19518 E Sunset Cir
- 4320 S Andes Way Unit 102
- 4217 S Argonne St
- 19562 E Sunset Cir
- 19585 E Sunset Cir
- 18967 E Mercer Dr
- 4363 S Genoa Ct
- 18947 E Mercer Dr
- 18844 E Union Place
- 19462 E Milan Cir
- 4542 S Gibraltar St
- 4206 S Halifax Way
- 4333 S Ceylon Way
- 4325 S Ceylon Way
- 19071 E Quinn Place
- 4323 S Ceylon Way
- 19081 E Quinn Place
- 4332 S Ceylon Way
- 4334 S Ceylon Way
- 4351 S Ceylon Way
- 19061 E Quinn Place
- 4326 S Ceylon Way
- 4336 S Ceylon Way
- 4321 S Ceylon Way
- 4353 S Ceylon Way
- 4324 S Ceylon Way
- 4342 S Ceylon Way
- 19062 E Quinn Place
- 4328 S Ceylon St
- 19082 E Quinn Place
- 4338 S Ceylon St
- 4318 S Ceylon St
Your Personal Tour Guide
Ask me questions while you tour the home.